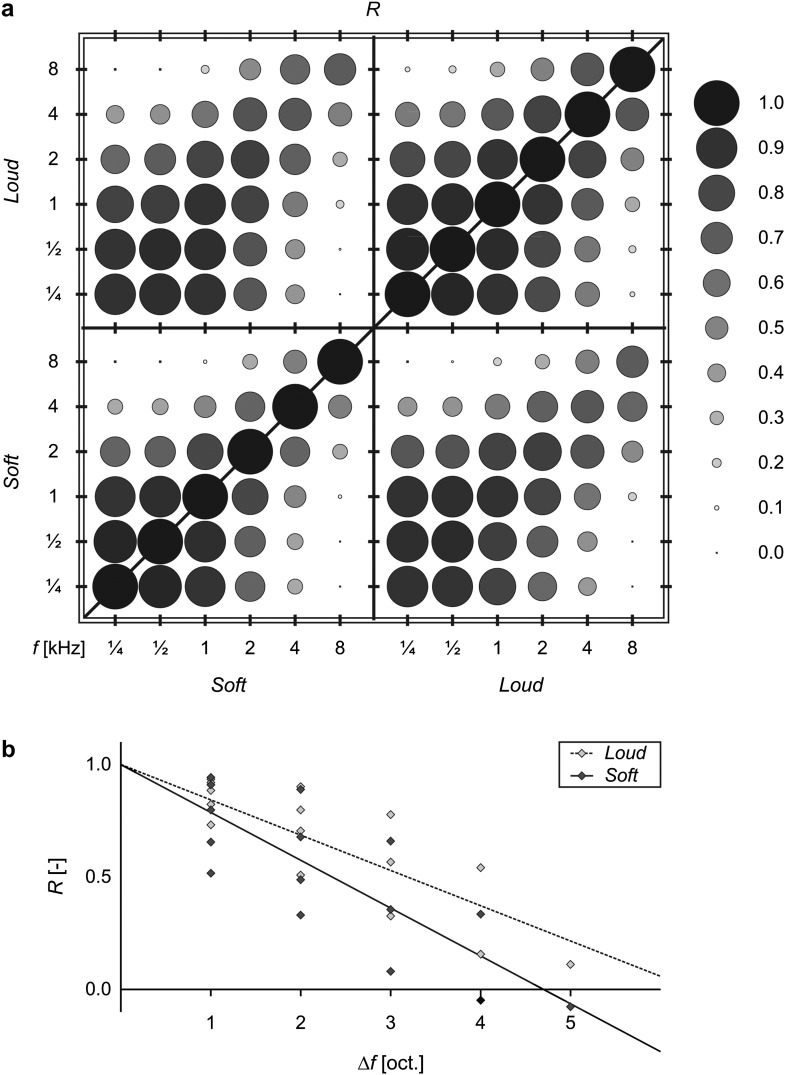
Figure 4.
Activations of all voxels in the ROI were correlated between pairs of stimuli. (a) The diameters of the disks reflect the similarity between the response maps to stimuli of varying frequency and loudness, as indicated by the value of the (Pearson) correlation coefficient R. (b) For all pairs of distinct frequencies, correlations R between pairs of soft stimuli (light diamonds, dotted line) or pairs of loud stimuli (dark diamonds, solid line) are plotted as a function of the frequency difference Δf (expressed in octaves). Correlations decreased as stimulus frequencies differed more strongly. Moreover, response maps to soft stimuli were more dissimilar than those to loud stimuli.

