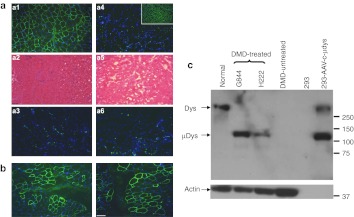
Figure 3.
Prolonged expression of c-µdys and muscle histology following treatment in dystrophic muscle. (a) a1 to a3 show muscle from the treated side of dog G844, and a4 to a6 were from the untreated side. Insert shows dystrophin expression (green) in muscle from a normal dog. a1 and a4 show c-µdys expression in green; a2 and a5 show H&E staining for muscle histology; a3 and a6 show staining of a CD8 T-cell marker in green. Blue is DAPI staining for nuclei. (b) Dystrophin expression in muscle from dog H222 in green. (c) Detection of c-µdys by western blot. The first four lanes contain lysates from dog muscle and the last 2 from 293 cells. Molecular weight markers (sizes in kD) are shown on the right and detected proteins on the left The high molecular weight band seen in the 293 cells transfected with the plasmid containing c-µdys is an artifact presumably due to plasmid rearrangement during transfection. However, a band of the size expected of c-µdys is clearly seen between the 100 and 150 kD size markers. As a control for the amount of protein in the dog muscle samples, an actin antibody that recognized an alpha actin found in skeletal muscle was used. No actin band is seen in the 293 cells because they make little to none of this form of actin, and there was less protein loaded in the two lanes containing lysates from 293 cell than in the ones from dog muscle (5 versus 30 µg, respectively). Bar = 100 µm. c-µdys, canine micro-dystrophin; DAPI, 4′, 6-diamidino-2-phenylindole; H&E, hematoxylin and eosin.

