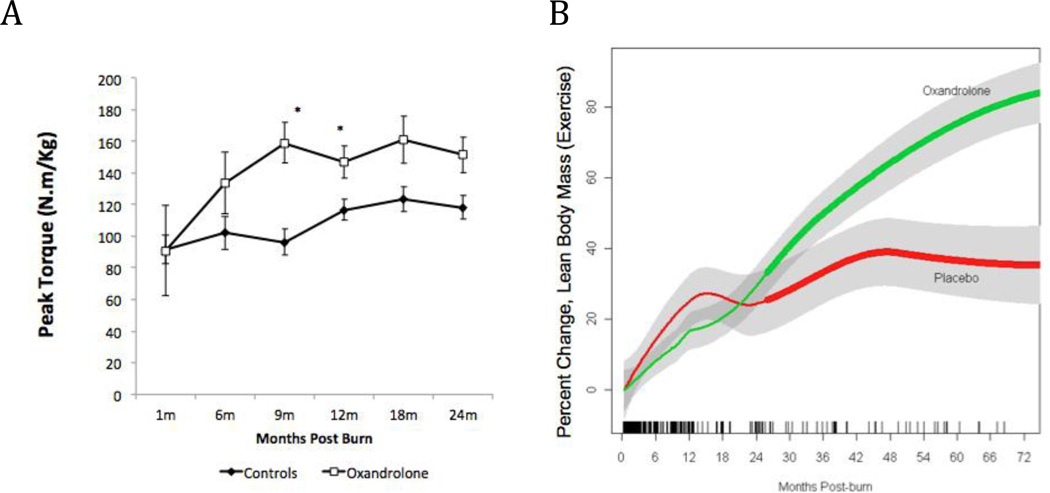
FIGURE 5. Exercise.
Combined effect of oxandrolone and exercise on percent change in (A) total lean body mass and (B) muscle strength. In (A), data are represented by the loess-smoothed trend in LBM with shading indicating +/− standard error. Hatch marks across the bottom represent the density of the sampled data at each time point (279 total observations). Time points at which differences are significant are indicated with wider lines (p<0.05). In (B), data are expressed as mean ± SEM. *p<0.05 vs control.

