
Figure 2.
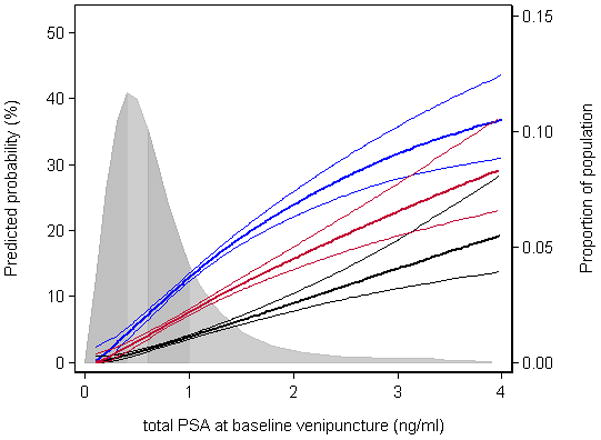
Long-term risk of prostate cancer according to PSA at age 44–50. Thick blue line, any prostate cancer; thick red line, palpable cancer; thick black line; advanced cancer. Thin lines represent 95% confidence intervals. Shaded area represents quartiles of population-based distribution of PSA values (0.42, 0.63, and 0.95 ng/mL). The curves differ from the curves for any cancer in Figure 1 because the analysis was not restricted to men diagnosed 20–25 years after venipuncture.