Figure 1.

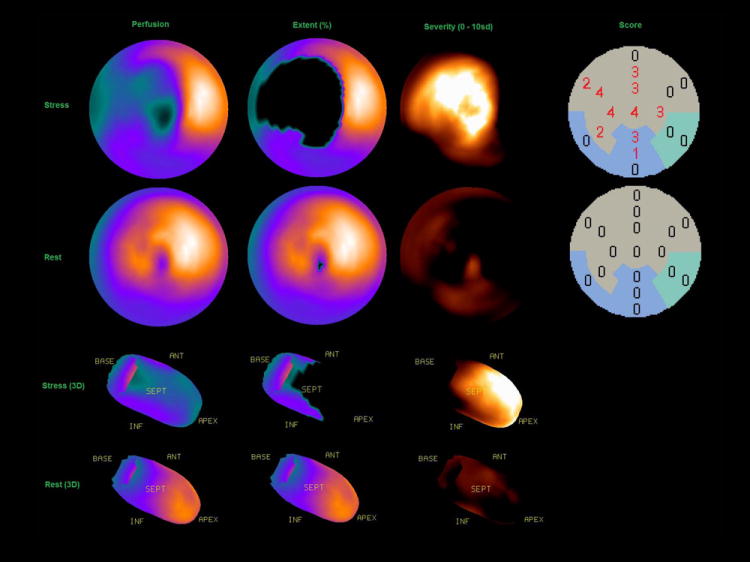
An example of quantitative polar map displays of extent, severity and automatically generated scores with stress (top) and rest (bottom).

An example of quantitative polar map displays of extent, severity and automatically generated scores with stress (top) and rest (bottom).