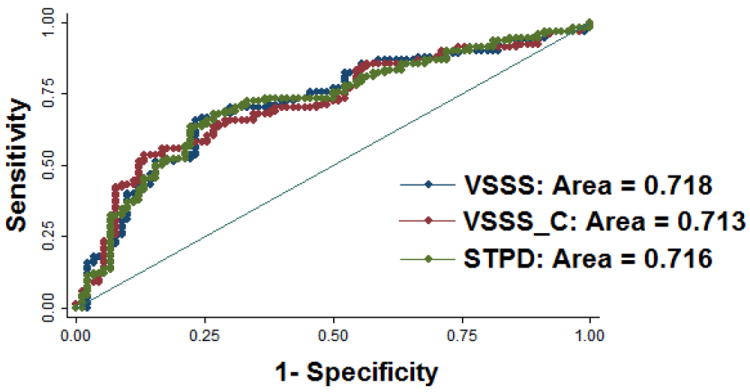
Figure 4.

Prediction of cardiac death by quantitative software and visual analysis. ROC curves for evaluating the prognosis power from Cox proportional hazard model including clinical and perfusion parameters. Red ROC curve is the result from the Cox model including clinical and visual perfusion parameters without clinical information and computer quantifications’ aids; blue ROC curve is the result from the Cox model including clinical and visual perfusion parameters with aids of clinical information and computer scores; green ROC curve is the result from the Cox model including the same clinical parameters as in the Cox model for generating red ROC curve and quantitative perfusion parameter. There was no difference in the area-under-the-curve when comparing quantitative and visual determination of myocardial perfusion. (Reproduced with permission from (25))
