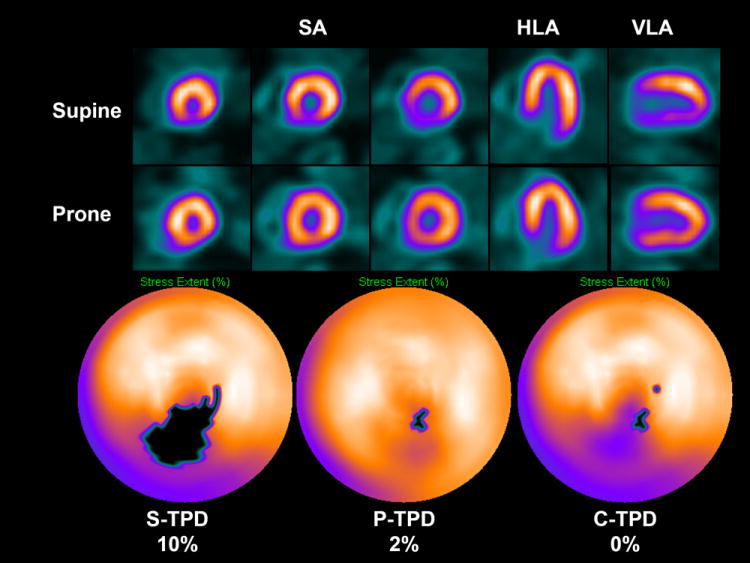
Figure 6.

Artifact avoidance by combined supine-prone analysis. An example of supine diaphragmatic attenuation artifact on MPS normalizing on prone MPS in 60-y-old male with history of diabetes, hypertension, hypercholesterolemia, and family history of premature CAD who achieved a heart rate of 148 (89% of maximum predicted heart rate). His body mass index was 34 and the ECG response to exercise stress was ischemic for ST segment depression. Subsequent coronary angiogram showed no significant stenosis. Images displayed in 3 short axis (SA), horizontal long axis (HLA), and vertical long axis (VLA) reveal apparent perfusion abnormality in inferior wall in supine images (top row); however, prone images show uniform tracer distribution (middle row). Quantitative results shown as black-out maps (bottom row) show 10% S-TPD, 2% P-TPD, and 0% C-TPD, consistent with absence of CAD. (Modified with permission from (41))
