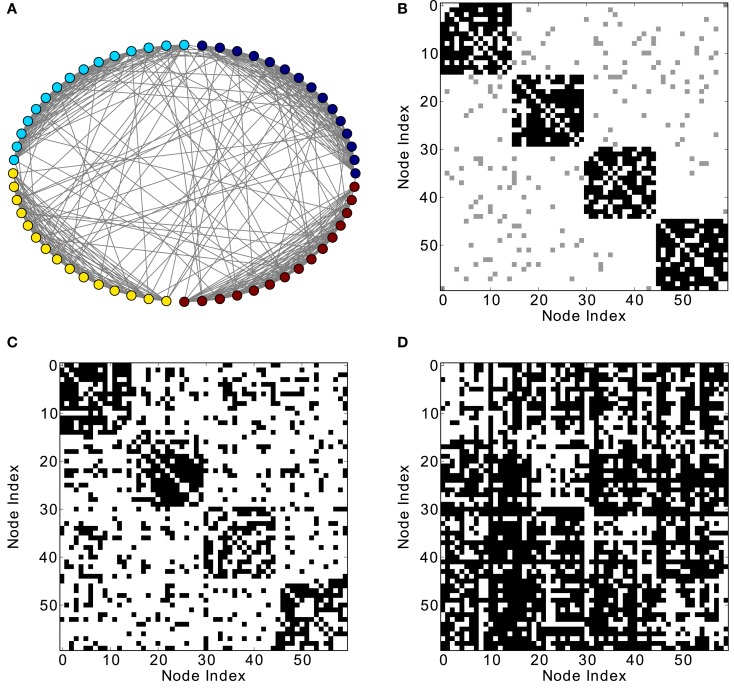
Figure 4.
Different network representations of a modular graph with 60 nodes and 800 links. (A) Graphical representation of the network (the color of the nodes represents membership to different modules) and (B) adjacency matrix (intra-module links are represented in black and inter-module links are represented in gray). Analysis of excitations: (C) average co-activation matrix with a threshold of 0.44 and (D) average co-activation matrix with time delay ±1 and threshold 0.28.

