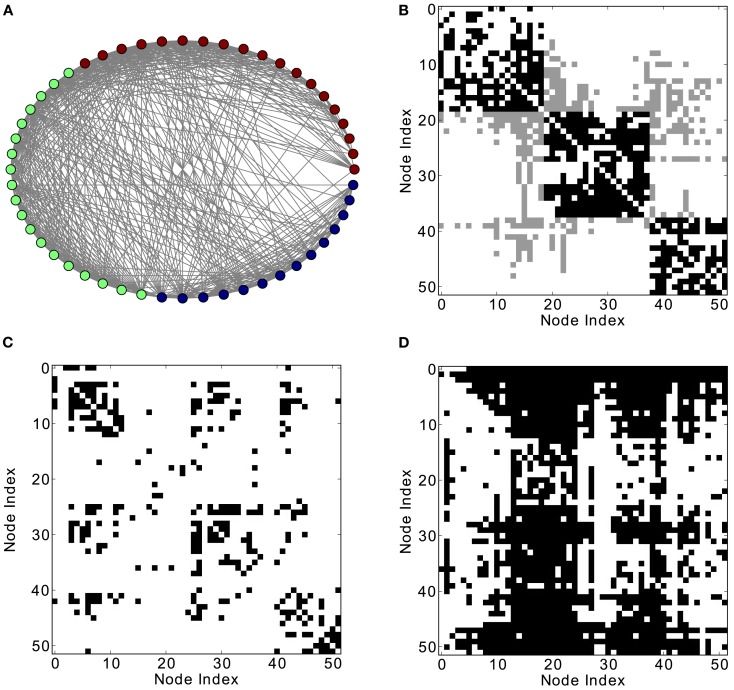
Figure 6.
Different network representations of the cortical connectivity of the cat (52 nodes and 820 links). (A) Graphical representation of the network (the color of the nodes represents membership to different modules) and (B) adjacency matrix (intra-module links are represented in black and inter-module links are represented in gray). Analysis of excitations: (C) average co-activation matrix with a threshold of 0.46 and (D) average thresholded co-activation with time delay ±1 and threshold 0.28.

