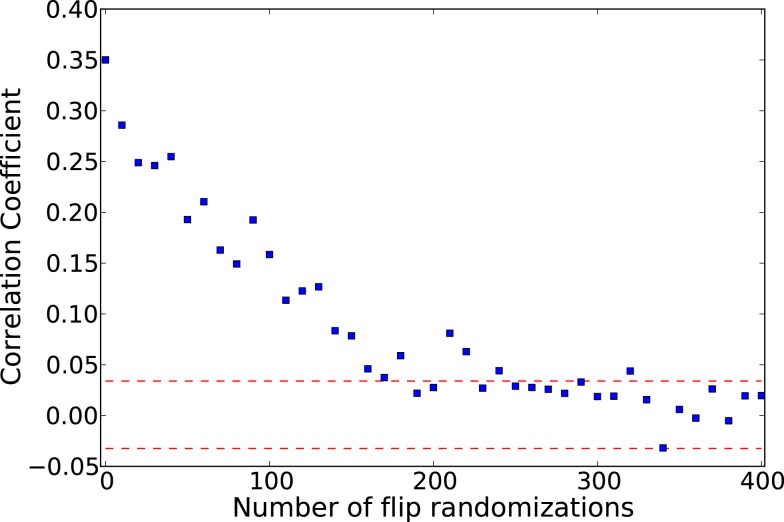
Figure A2.
Correlation coefficient between the adjacency matrix and the average co-activation matrix, for a fixed threshold, starting with the artificial ER-modular graph shown in Figure 4 and then randomizing the connections toward a ER-random graph. The fixed threshold 0.45 was chosen where the correlation coefficient between the adjacency and the co-activation matrix of the ER-modular is maximal (see Figure 5A)

