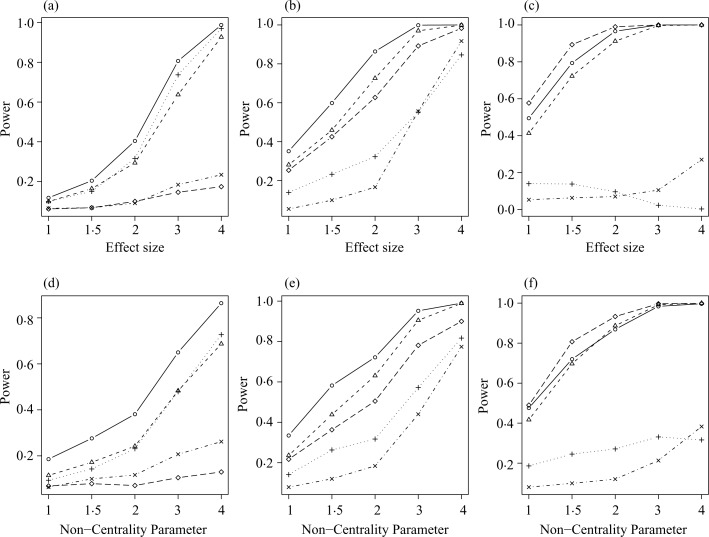
Fig. 2.
Power comparison for various numbers of outlier tissues for (a)–(c) normal distribution with an effect size of 1, 2 and 3, respectively, and for (d)–(f) t-distribution with 4 degrees of freedom and noncentrality of 1, 2 and 3, respectively. The following approaches are illustrated: distribution-based p-value for the outlier sum (○); outlier robust t-statistic (▵); outlier sum (+); cancer outlier profile analysis (×); and two-sample t-test (♦).

