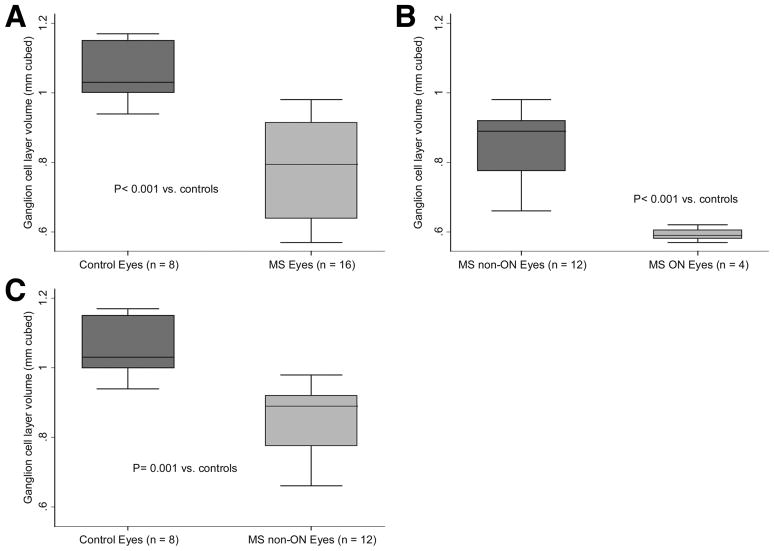
FIG. 2.
Box plots show ganglion cell layer volumes of A. MS patient vs. disease-free control eyes, B. MS patient eyes with prior history of ON vs. MS patient eyes without a prior ON history, and C. MS patient eyes without a prior history of ON vs. control eyes.
Abbreviations: MS = multiple sclerosis; ON = optic neuritis
* The lines in the box represent the medians, and boxes delineate the interquartile range (25th to 75th percentiles). Whiskers represent the range of observations minus outliers (no outlier values in this sample). P values are based on generalized estimating equation (GEE) models accounting for age and within-patient, inter-eye correlations.

