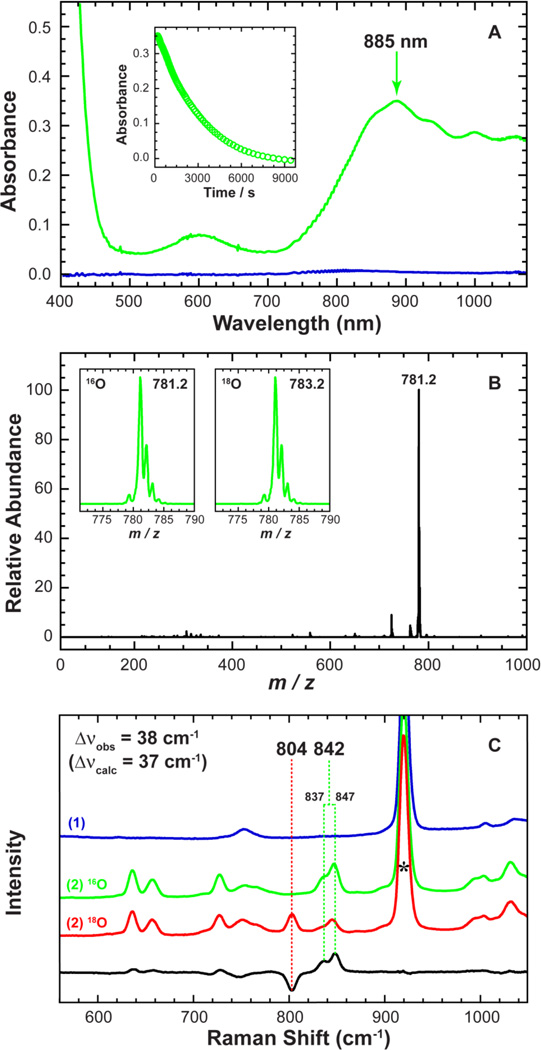
Figure 3.
Top (A): UV-Vis spectra of 1 (blue) vs. intermediate 2 (green). 2 was generated in the reaction of 1 (1.0 mM) and two equivalents of PhIO in CH3CN at 15 °C. The inset shows the natural decay of 2 monitored at 885 nm (t1/2 ≈ 40 min). Middle (B): EIS-MS spectrum of intermediate 2. Inset shows observed isotope distribution patterns of 2 in 16O (left) and 18O (right). 2-18O was generated in the reaction of 1 (0.50 mM) and two equivalents PhIO in the presence of H2 18O in CH3CN at 15°C. Bottom (C): Resonance Raman spectra of 1 (blue), and 2 prepared in the presence of H2 16O (green) and H2 18O (red) showing the isotope sensitivity of the 842 cm−1 band. The black line shows the intensity difference between 2-16O and 2-18O. The peak marked with * is from solvent.

