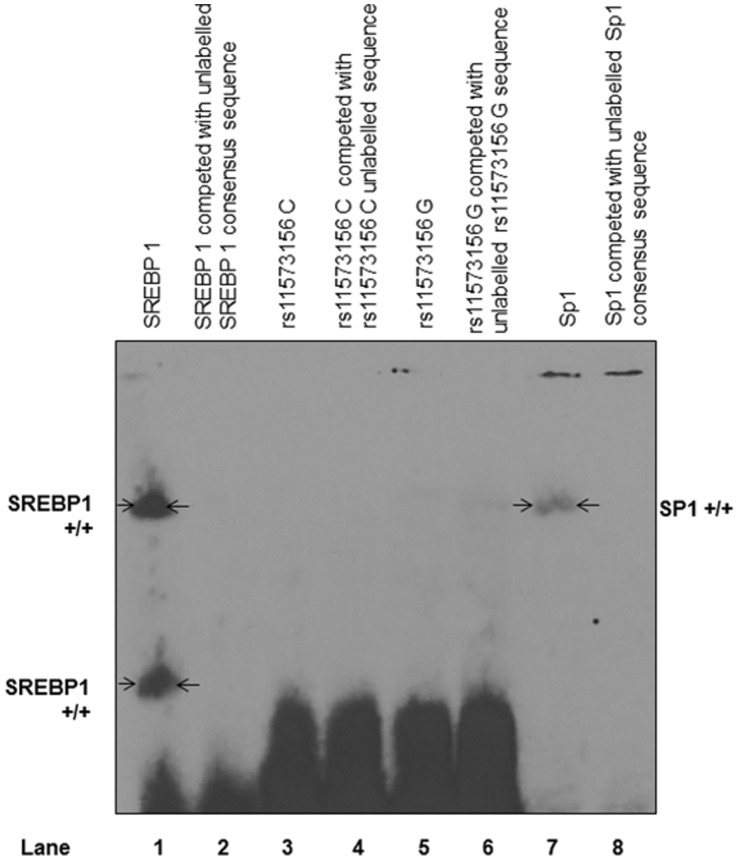
Figure 7. EMSA Analysis of Potential Differential Binding for rs11573156 C and G Variants.
EMSA image of rs11573156 C and G alleles showing no transcription factor binding. Lane 1 is SREBP 1 positive control that shows specific bands that are competed out with an unlabelled SREBP 1 consensus sequence in lane 2. Lanes 3 and 4 show rs11573156 C (wild type) labelled and competed with unlabelled C competitor respectively. There is no specific binding. Lanes 5 and 6 represent rs11573156 G (rare) labelled and competed with unlabelled G competitor respectively, again with no specific binding. Lane 7 represents a second positive control with Sp1 specific binding and in Lane 8, labelled Sp1 with unlabelled Sp1 competitor that competes out Sp1 specific bands.

