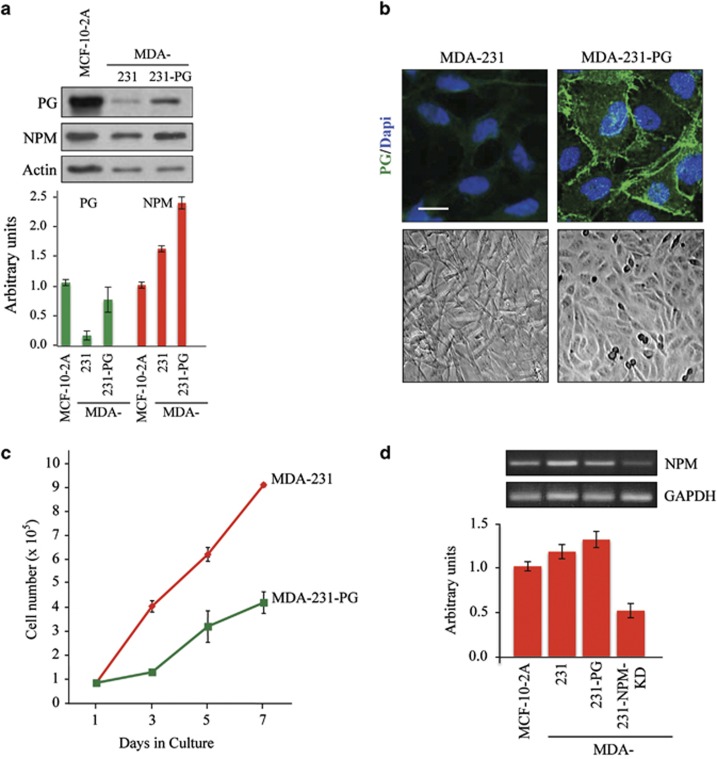
Figure 1.
Characterization of plakoglobin expressing MDA-231 cells (MDA-231–PG). (a) Total cell lysates from MDA-231, MDA-231-PG and MCF-10-2A (control) were processed for western blot using PG, NPM and actin antibodies. Histograms were generated by normalizing the amount of each protein in each cell line to the amount of actin in the same line relative to MCF-10-2A cells. Quantitation for the PG transfectants represents the average of multiple independent clones (Supplementary Figure 1). Each experiment was repeated three to five times and a typical western blot is shown. (b) MDA-231 and MDA-231-PG cells were grown to confluence, viewed under a phase contrast microscope and photographed using the × 20 objective. To visualize the subcellular distribution of PG, confluent cultures grown on glass coverslips were extracted with CSK buffer, fixed with formaldehyde and stained with PG antibodies. Nuclei were counterstained using DAPI. Images were captured using a × 63 objective of a laser scanning confocal microscope, enlarged × 2 and photographed. Bar, 10 μm. (c) Replicate cultures of MDA-231 and MDA-231-PG were established at single cell density and cells were counted at 1, 3, 5 and 7 days. Each time point represents the average of three independent experiments. For MDA-231-PG transfectants the values are the average of multiple independent clones. The absence of error bars at some time points is because of the small differences among the experiments. (d) Total cellular RNA was isolated from MCF-10-2A, MDA-231, -231-PG and -231-NPM-KD (MDA-231 cells expressing NPM shRNA) cells, reverse transcribed and processed for PCR using primers specific to NPM and GADPH. The histogram represents the NPM/GAPDH ratio for each cell line normalized to MCF-10-2A cells. Quantitations for theMDA-231-PG and MDA-231-NPM-KD transfectants represent the average of multiple independent clones (Supplementary Figure 5). Each experiment was repeated at least three times and a typical blot is presented.

