Figure 1.
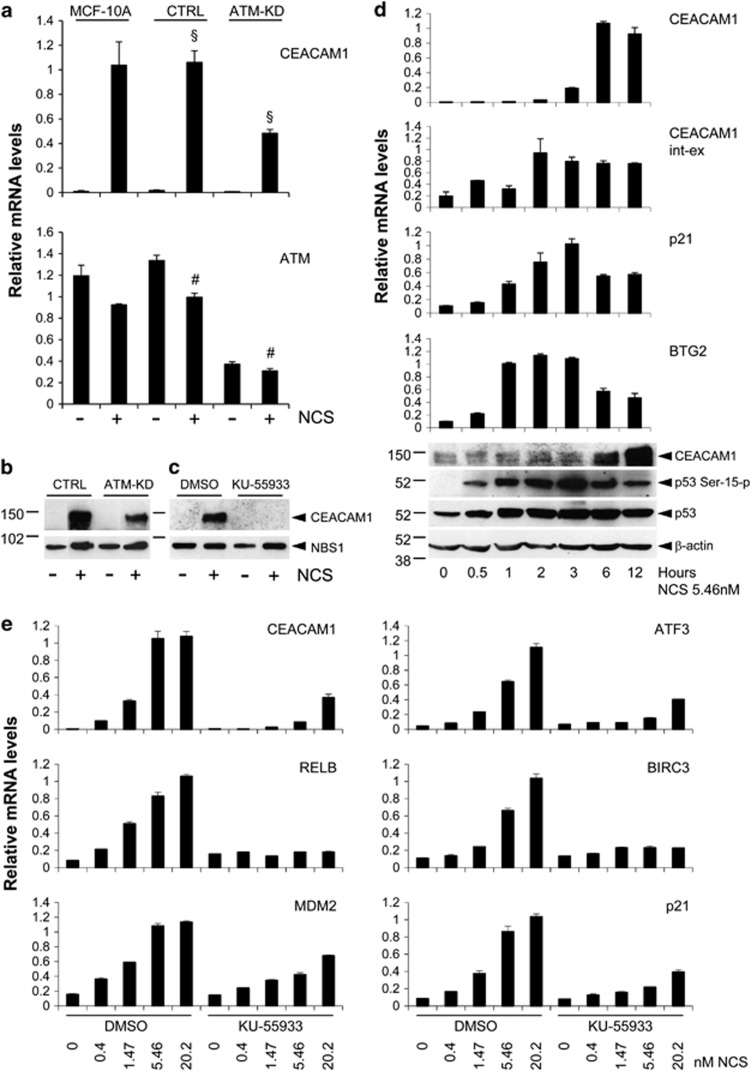
CEACAM1 is upregulated by NCS in an ATM-dependent manner. (a) Parental MCF-10A cells (MCF-10A) or MCF-10A cells stably expressing an ATM shRNA vector (ATM-KD) or a scrambled shRNA vector (CTRL) as a control were incubated for 4 h in the presence or the absence of 20 nM NCS. At the end of the incubation, total RNA was extracted and analyzed for the levels of CEACAM1 or ATM expression by quantitative real-time PCR. The values in the graph represent the mean±s.e.m. from three independent experiments. §P<0.005; #P<0.001. (b) MCF-10A cells stably expressing an ATM shRNA vector (ATM-KD) or a scrambled shRNA (CTRL) were incubated for 16 h in the presence or the absence of 5.46 nM NCS. At the end of the incubation, total proteins were extracted and analyzed for the levels of CEACAM1 or Nijmegen breakage syndrome 1 (NBS1) expression by western blotting. (c) Parental MCF-10A cells were incubated for 1 h in the presence of 10 μM KU-55933 or the same dilution of dimethyl sulfoxide (DMSO (solvent)) as a control, followed by 16 h incubation in the presence or the absence of NCS 5.46 nM. At the end of the incubation, total proteins were extracted and analyzed for the levels of CEACAM1 or NBS1 expression by western blotting. In b and c, numbers on the left indicate kDa. (d) MCF-10A cells were incubated in the presence of 5.46 nM NCS for the times indicated. At the end of the incubation, the cells were split into two parts and either processed for protein extraction or for total RNA purification. RNAs were analyzed for the levels of CEACAM1, CEACAM1 primary transcript (CEACAM1 int-ex), p21/Waf1 or BTG2 by quantitative real-time PCR in triplicates. Error bars indicate s.d. within the internal replicates. Proteins were analyzed for the levels of CEACAM1, p53 Ser 15-p, p53 or β-actin (lower panel). Numbers on the left indicate kDa. (e) MCF-10A cells were incubated for 1 h in the presence of 10 μM KU-55933 or the same volume of DMSO (solvent) as a control, followed by 4 h in the presence of the indicated concentrations of NCS. At the end of the incubation total RNAs were purified and analyzed for the levels of the indicated genes by quantitative real-time PCR in triplicates. Error bars indicate s.d. within the internal replicates.

