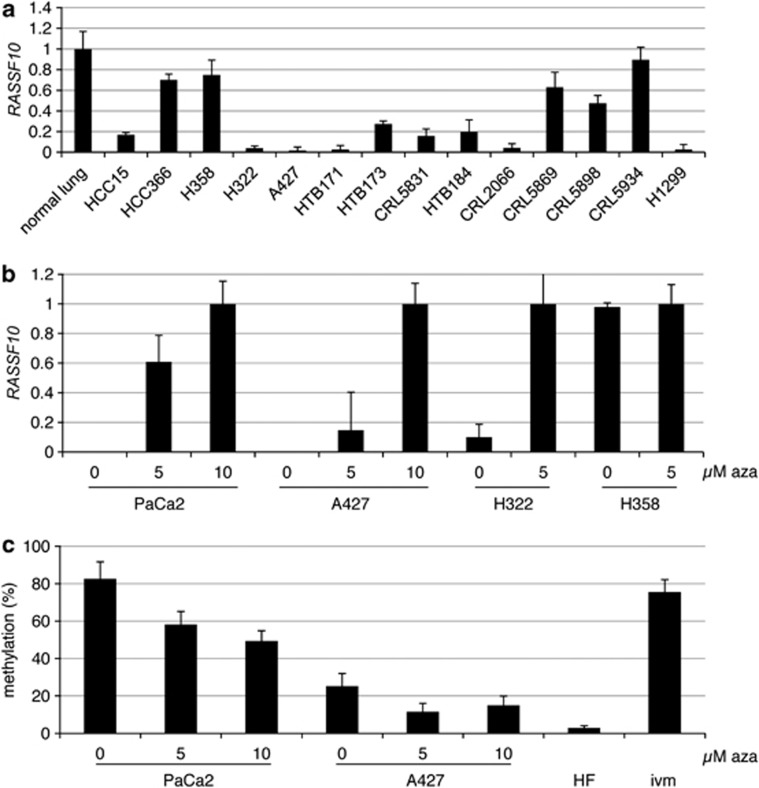
Figure 2.
RASSF10 expression in lung cancer, reexpression and demethylation under aza treatment. (a) Expression analysis of RASSF10 is shown in lung cancer cell lines vs normal lung (=1) and was normalized to ACTB expression using qRT–PCR. (b) Aza treatment (0, 5 and 10 μℳ) was performed of the pancreatic cancer cell line PaCa2 and lung cancer cell lines A427, H322 and H358. RASSF10 was analyzed by RT–PCR after 4 days and normalized to ACTB. 10 μℳ PaCa2, 10 μℳ A427, 5 μℳ H322 and 5 μℳ H358 was set to 1. (c) RASSF10 promoter methylation analysis was performed in PaCa2 and A427 and quantified by pyrosequencing. Seven CpGs are included in analyzed region and respective mean and SD are shown. In vitro methylated (ivm) genomic DNA and human fibroblasts (HF) are used as control.

