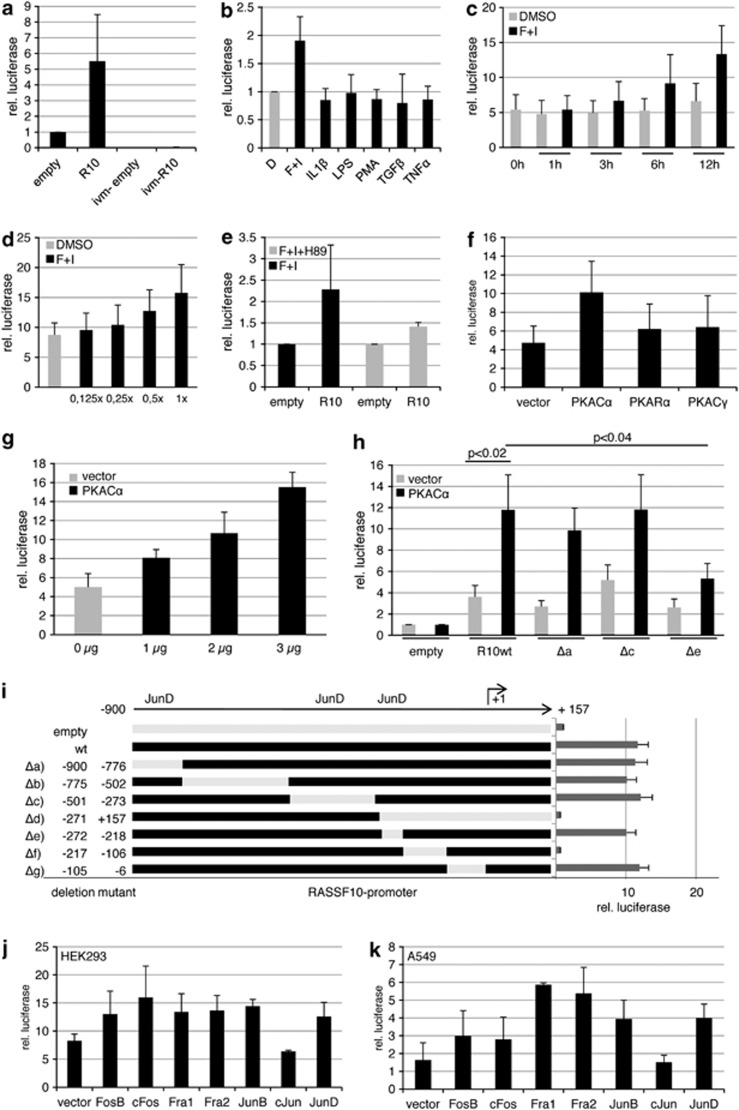
Figure 3.
Forskolin, PKA and AP-1 family members induce the RASSF10 promoter. Luciferase assay was performed in HEK293 cells transfected with pRLnull (empty), RASSF10 promoter construct and pGL3 for transfection control. (a) The relative luciferase activity is shown 12 h after transfection in empty or RASSF10-pRLnull (R10) and in vitro methylated (ivm) plasmids. (b) The RASSF10 promoter response to cytokines (20 μℳ forskolin, 500 μℳ IBMX, 10 ng/ml IL1β, 1 μg/ml LPS, 50 nℳ PMA, 2 ng/ml TGFβ, 20 ng/ml TNFα) in comparison with dimethyl sulfoxide (DMSO) (D; set 1) is shown. R10 was normalized to similarly treated empty vector for each condition. (c) Time-dependent induction of R10 under mock (DMSO) or forskolin/IBMX (F+I) treatment from 1 to 12 h was analyzed. The empty vector for each time point and stimulation was set 1. (d) Dose-dependent induction of R10 under mock (DMSO) or increasing amounts of F+I is shown (1x: 20 μℳ forskolin and 500 μℳ IBMX). Empty vector for each dose was set 1. (e) Forskolin induction of the RASSF10 promoter was inhibited by 10 μℳ H89. Empty was set 1. (f) The PKA effect on RASSF10 promoter induction was analyzed by cotransfecting empty vector or PKA isoforms (Cα, Rα and Cγ). Empty pRLnull was transfected accordingly and set 1. (g) Dose-dependent induction under increasing amounts of PKACα in comparison with vector control is shown. Empty pRLnull was transfected accordingly and set 1. (h) The effect of PKACα on RASSF10 deletion constructs (Δa: -900/-776; Δc: -501/-273; Δe: -272/-218) and wt promoter is depicted. Empty pRLnull was set 1 under vector or PKACα cotransfection. (i) RASSF10 wt promoter activity is shown in comparison with deletion mutants from –900 to +157 bp relative to transcription start site (+1). JunD binding sites are indicated. (j, k) Cotransfected AP-1 members affect the RASSF10 promoter in HEK293 or A549 cells. Empty pRLnull was transfected with AP-1 members and was set 1. Results represent mean of three different experiments (SD is indicated). In (i) a representative experiment is shown (SD is shown). P values were calculated using two-tailed t-test.

