Figure 4.
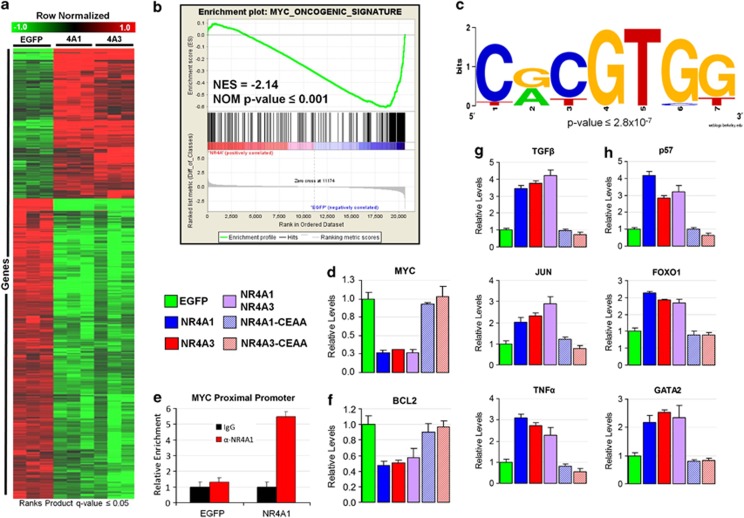
Transcriptional redundancy of NR4A1 and NR4A3 function is revealed by genome-wide expression profiling. (a) Heatmap depiction of RP-identified genes differentially expressed in NR4A1- or NR4A3-transfected cells as compared with EGFP transfections (RP Q-value ⩽0.05) 14 h post-electroporation. Note the high redundancy of NR4A1 and NR4A3 transcriptional regulatory function and large number of suppressed genes. (b) Gene Set Enrichment analysis of NR4A-regulated genes reveals significant antagonism of MYC activity, accounting for a significant number of NR4A suppressed genes. (c) AMADEUS promoter analysis of NR4A suppressed genes identified enrichment of the MYC-interacting E-box sequence (bootstrap P-value ⩽2.8 × 10⁻⁷). Consensus sequence generated with WebLogo software. (d) Quantitative PCR analysis reveals transcriptional suppression of MYC mRNA by NR4A1 and NR4A3, and (e) 4 h Chromatin immunoprecipitation assay reveals NR4A1 occupancy of the MYC promoter. (f) NR4As also suppress the MYC cooperating gene BCL2. Quantitative PCR validation of (g) Ingenuity Pathway Analysis identified NR4A-signaling hubs and (h) critical HSC regulatory genes p57, FOXO1 and GATA2. All genes were found to be regulated in a non-synergistic and DBD-dependent manner.

