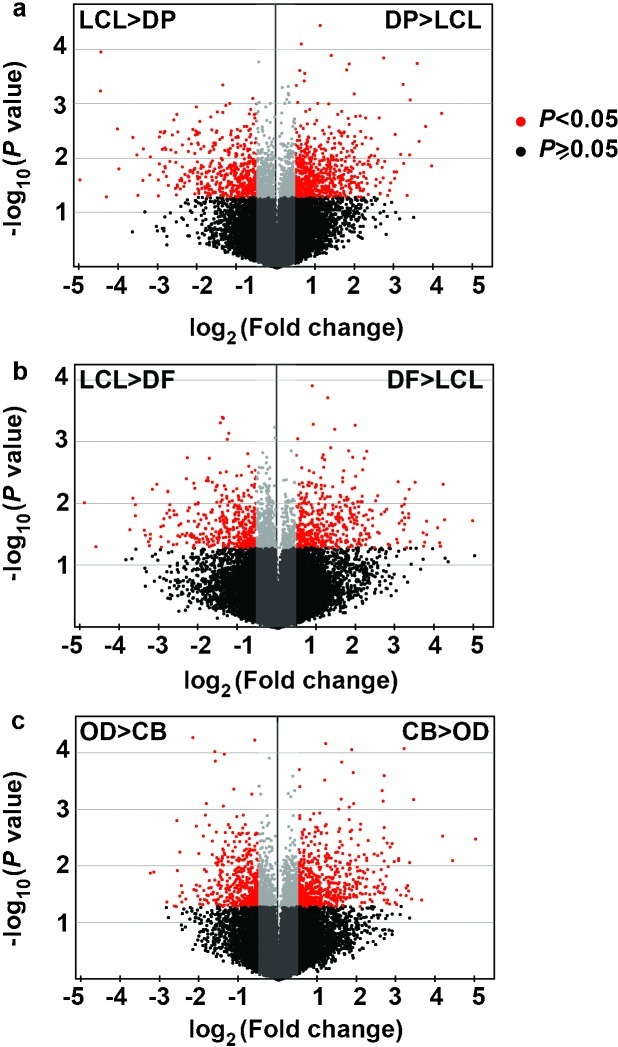
Figure 3.
Volcano plots for differential expression of genes in LCL epithelia, adjacent DP mesenchyme, DF mesenchyme, root OD and CB. Unpaired t-tests were used to compare differences in gene expression. Genes with statistically significant difference at P<0.05 and FC (fold change) ≥2 are shown in red,while those with P≥0.05 or FC<2 are shown in grey or black (not statistically significant). CB, cementoblasts; DF, dental follicle; DP, dental papilla; LCL, lingual cervical loop; OD, odontoblasts.

