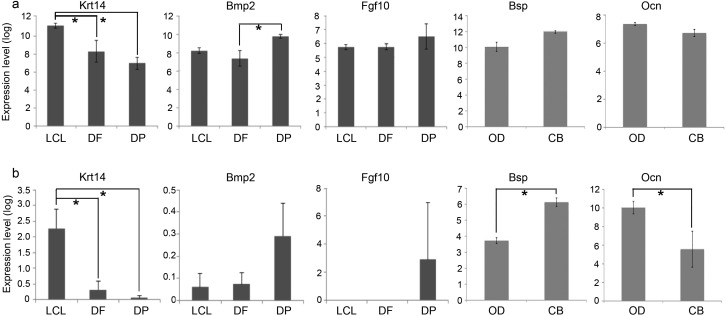
Figure 4.
Comparison of mRNA expression data from microarray vs. RT-PCR. Genes known to be differentially expressed were selected and compared. mRNA expression levels derived from microarrays (a) were normalized by using the RMA method and those derived from quantitative RT-PCR (b) were normalized to the expression level of house keeping gene Gapdh as described in the ‘Materials and methods' section. For LCL epithelium,Krt14; for dental mesenchyme including DF and DP,Bmp2 and Fgf10; for CB,Bsp; and for OD,Ocn. Differential expression patterns of these genes in LCL,DF,DP,CB and OD were generally consistent between microarray and RT-PCR data,though differences in measured gene expression levels between tissue/cell types were more robust in the data from RT-PCR than those from microarray. Bmp2,bone morphogenetic protein 2; Bsp,bone sialoprotein; Fgf10,fibroblast growth factor 10; Gapdh,glyceraldehyde 3-phosphate dehydrogenase; Krt14,cytokeratin 14; Ocn,osteocalcin; OD,odontoblasts; RMA,robust multichip average; RT-PCR,reverse transcriptase polymerase chain reaction.

