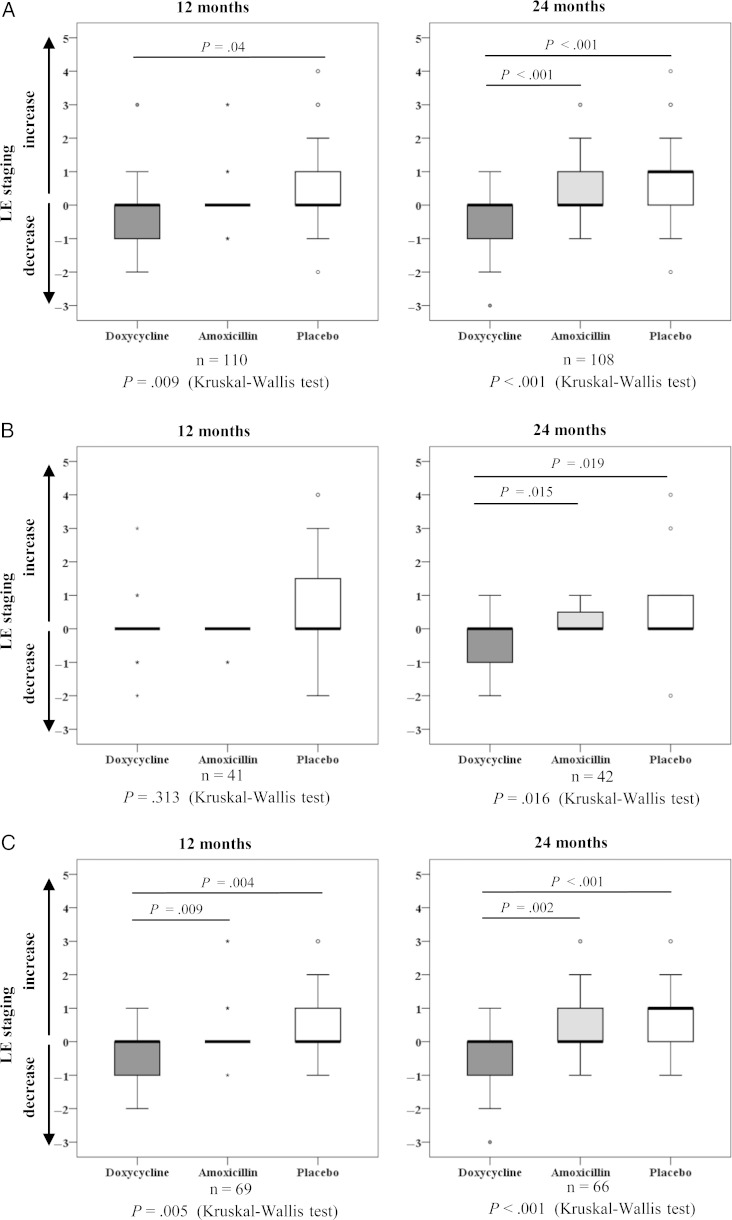
Figure 2.
Lymphedema (LE) staging. Differences in LE severity at 12 and 24 months compared with pretreatment severity is shown for each treatment group, according to per-protocol analysis. A, Box plots for all patients. B, C, Differences for the circulating filarial antigen (CFA)–positive (B) and CFA-negative (C) subgroups. For all figure parts, 0 denotes no change in LE stage, changes to <0 denote a decrease to lower LE stages, and changes to >0 denote an increase to higher LE stages. Abbreviation: LE, lymphedema.

