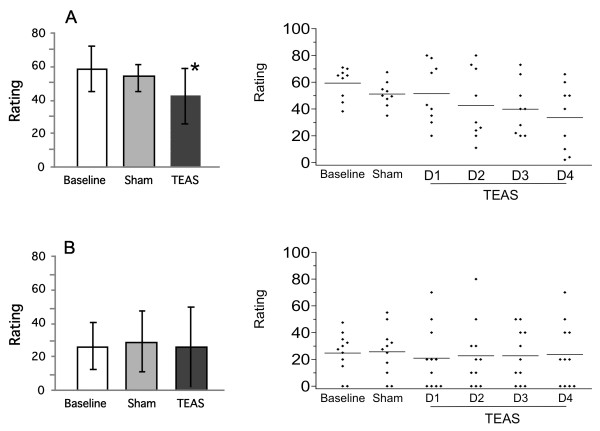
Figure 3.
Ratings of anxiety during each phase of the study for cocaine and marijuana participants. Anxiety was rated on a 100 mm line with anchors of ‘none’ to ‘extremely’. Left panels are group mean ± SD; right panels are individual participant scores (averaged during Baseline and Sham, but by separate days during TEAS treatment).* significantly different from baseline, P < 0.05. A: Anxiety of cocaine subjects; B: Anxiety of marijuana subjects.

