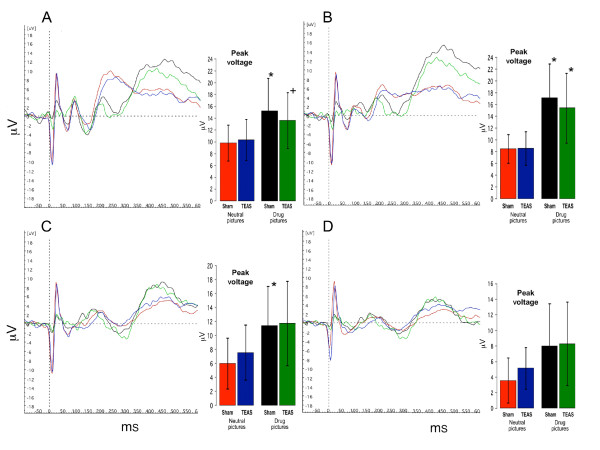
Figure 4.
Averaged ERP for four conditions in cocaine abusing subjects (n = 9). Red lines and bars represent averaged responses to neutral pictures after sham TEAS treatment; Blue lines and bars represent responses to neutral pictures after active TEAS treatment; Black lines and bars represent responses to drug pictures after sham TEAS treatment; Green lines and bars represent responses to drug pictures after active TEAS treatment. Bar graph inserts show magnitude of peak response in μV (mean ± SD) averaged across subjects. * indicates significant differences between responses to drug pictures and neutral pictures (P < 0.05). + indicates a statistical trend (P = 0.06). A: Oz; B: Pz; C: Cz; D: Fz.

