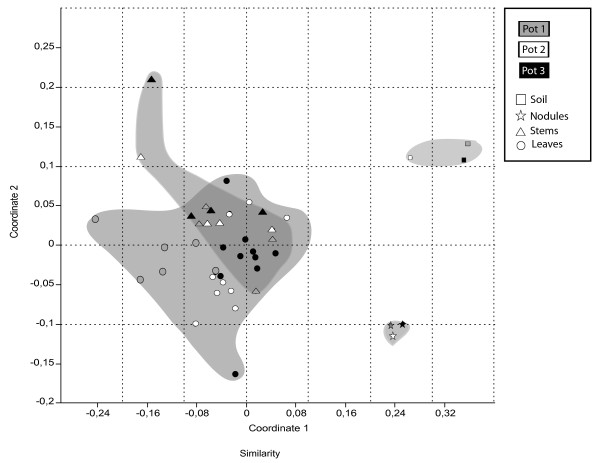
Figure 1.
Pattern of similarities of individual T-RFLP profiles from total community analysis. The pattern of similarity has been inspected by using Nonmetric Multidimensional scaling (N-MDS) based on Jaccard similarity matrix. Stress of N-MDS = 0.1896. Stars indicate nodules; squares, soils; circles, leaves; triangles, stems. Grey filling, pot 1; white, pot 2; black, pot 3. Samples of the same environment were grey shaded.

