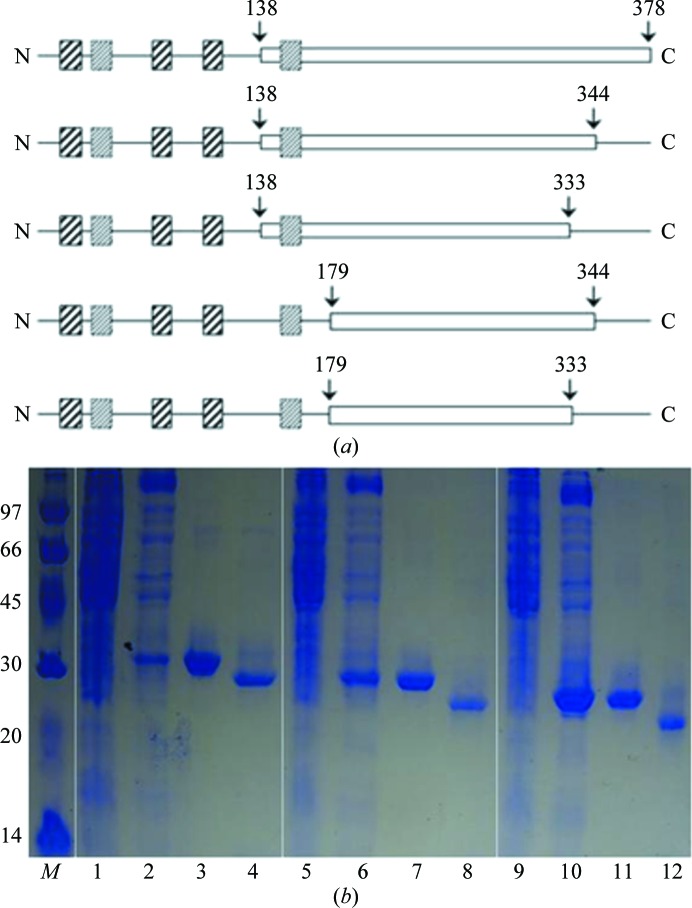
Figure 1.
(a) The domain architecture and constructs used in these studies. Strongly predicted transmembrane segments are shown as boxes containing solid lines, while weakly predicted transmembrane segments are shown as boxes containing dotted lines. The constructs are indicated by white boxes; the starting and ending positions are indicated by arrows. (b) 13% SDS–PAGE monitoring of the overexpression and purification of the STING138–378 (lanes 1, 2, 3 and 4), STING138–344 (lanes 5, 6, 7 and 8) and STING138–333 (lanes 9, 10, 11 and 12) domains. Lane M, protein marker (labelled in kDa); lanes 1, 5 and 9, whole cell lysate before IPTG induction; lanes 2, 6 and 10, whole cell lysate after IPTG induction; lanes 3, 7 and 11, nickel-column-purified domains after IPTG induction; lanes 4, 8 and 12, nickel-column-purified domains after TEV cleavage.

