Figure 1.
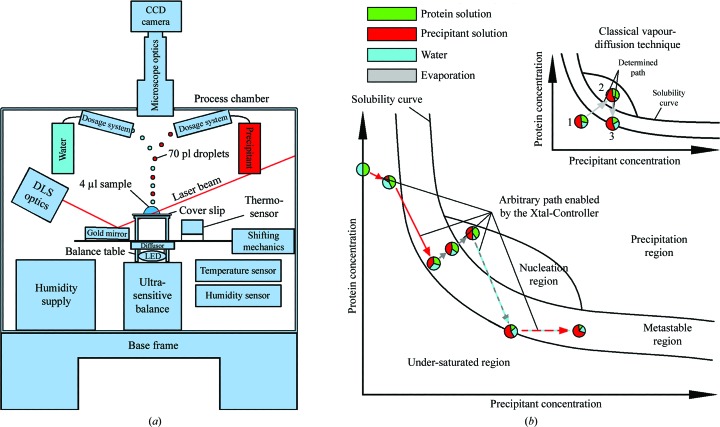
(a) Diagram of the Xtal-Controller. A gold mirror directs the DLS laser beam into the drop and guides the scattered light back to the detector. The sample is illuminated by a white-light LED source. The light passes through an optical diffusor to ensure smooth illumination. The droplet generators are positioned above the sample. To obtain a uniform temperature distribution, the body of the process chamber is made of aluminium and is thermally isolated by polyurethane foam. (b) Schematic depiction of navigation in the phase diagram made possible by the Xtal-Controller in comparison with classical vapour-diffusion experiments. The composition of the sample components, protein, precipitant and solvent, can be changed actively, quantified in situ and measured by DLS at the same time. In the three experiments reported here, water was the solvent. The various colouring patterns of the arrows indicate which dosage systems are active in achieving the desired ratios of water, precipitant and protein. The circles are pie charts that show ratios of the measured components, protein, solvent and precipitant, and indicate changes of the ratios within the sample drop at different positions in the phase diagram. Dashed coloured arrows indicate an alternating activity of two dosage systems or one dosage system along with evaporation. The grey and turquoise dashed arrow indicates evaporation and almost compensating water addition. The outcome of this is an extremely slow net weight loss caused by evaporation. A red and turquoise dashed arrow indicates an addition of precipitant, while loss of water caused by evaporation during this time is almost compensated by simultaneous addition of water. Consequently, precipitant solution replaces solvent bit by bit. In contrast to this, a common vapour-diffusion experiment is completely pre-defined by the concentration ratios of the components at the start of the experiment. Changing the path through the phase diagram requires alteration of the experimental setup.

