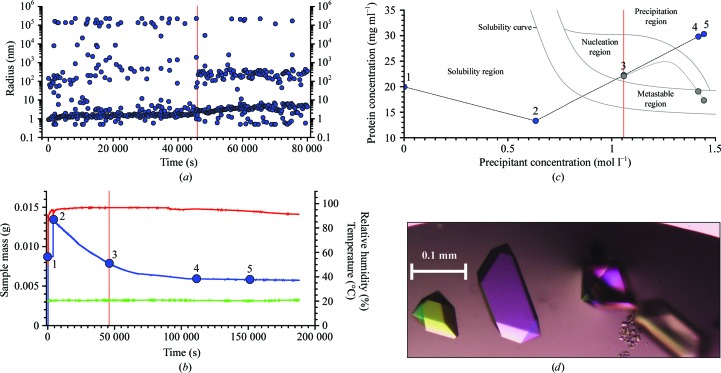
Figure 2.
Crotamine crystallization. (a) Radius distributions obtained by DLS during the first 80 000 s of the crystallization process. The vertical red line indicates the moment when nucleation was detected by the emergence of a second distinct radius peak. (b) Plots of measured values of the sample mass (blue), humidity (red) and temperature (green) during the experiment. Until crystallization begins, the concentrations of protein and precipitant are known at every moment of the experiment. Positions 1–5 are used to show the positions in the phase diagram. Position 3 at 46 000 s corresponds to the start of the nucleation region. (c) Phase-diagram positions derived from the microbalance. Point 3 indicates the observed nucleation event when the system enters the nucleation region. Points 4 and 5 show the trajectory of protein and precipitant concentrations calculated based on weight changes caused by water evaporation had precipitation not begun. The grey curve indicates the estimated effective path of the protein concentration as it is reduced by phase transition and crystal growth. In contrast to this, the precipitant concentration can be precisely calculated since the precipitant remains dissolved. (d) Examples of the crotamine crystals produced.

