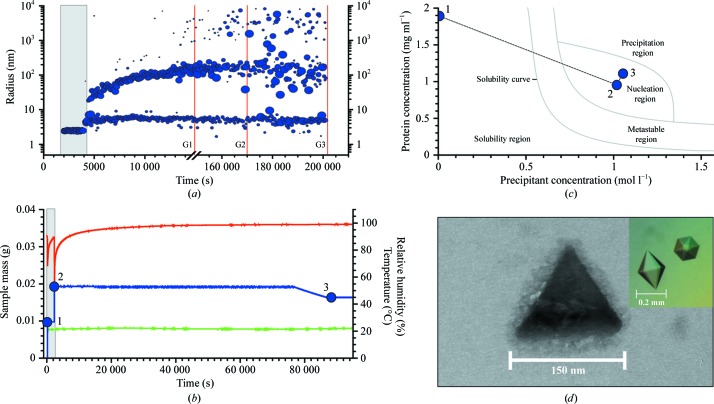
Figure 4.
Mistletoe lectin I was used to produce crystalline nanoparticles. (a) Radius distributions obtained by DLS during the crystallization process. Note the break in the time axis. The lines G1, G2 and G3 indicate when aliquots were taken. (b) Plots of the measured values of the droplet mass (blue), the humidity (with a maximum value of 99%; red) and the temperature (green). Recording was not continued after the first aliquot was taken because of the balance disturbance. Three positions are numbered 1, 2 and 3. The grey area in both diagrams shows the initial phase before addition of the precipitant. (c) Positions in the phase diagram shortly before and after addition of the precipitant. These correspond to the three positions highlighted in (b). (d) Electron-microscopic image of a nanocrystal taken at time G3 revealed that cystalline nanoparticles with edge lengths of approximately 150 nm are present in the solution. Surprisingly, the crystalline particles are shaped as equilateral triangles concordant with tetrahedral geometry of the particles, whereas typical mistletoe lectin crystals observed by an optical microscope have a hexagonal bipyramidal morphology (insert). We have no reason to doubt that these nanocrystals would also grow in the same hexagonal bipyramidal morphology if the growth time were extended.

