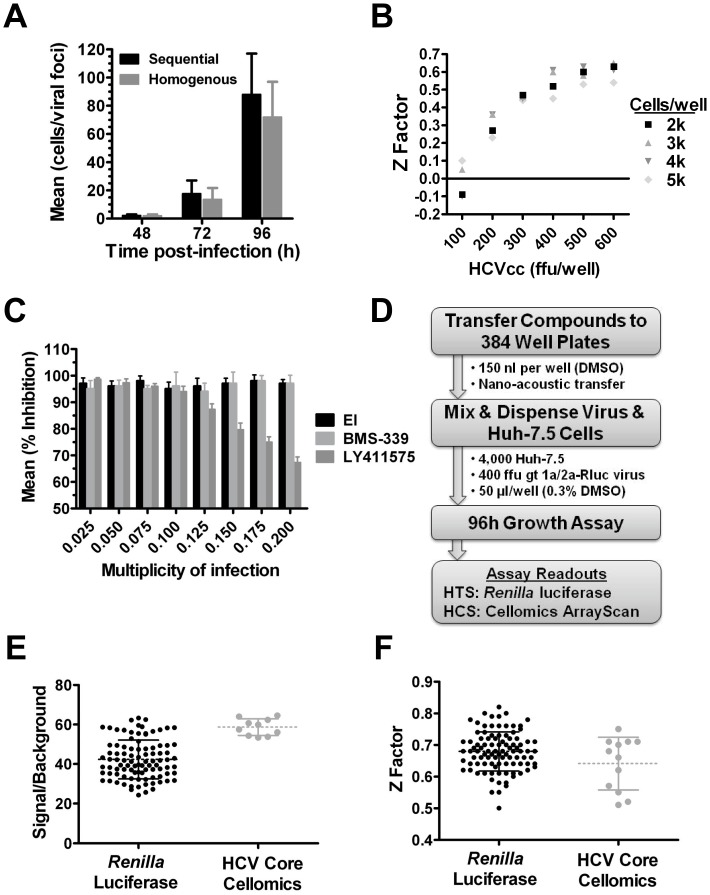
Figure 2. Optimization of a high-throughput 384 well virus replication assay.
A. Comparison of virus replication over time (cells/viral foci) following infection using a standard protocol where virus was added to adherent Huh-7.5 cells (pre-plated 24 h prior to infection) or a homogenous protocol where virus and trypsinized cells were co-dispensed into a well. B. Co-titration of genotype 1a/2a-Rluc virus and Huh-7.5 cells to determine Z factor values in a 96 h assay. C. Effect of MOI on % inhibition obtained with entry (EI), genome replication (BMS-339) and virus assembly (LY411575) inhibitors in a 96 h assay. D. HTS assay strategy. E & F. HTS assay quality control. Plate-to-plate variability in signal/backgroundr (E) and Z factor (F) was determined for the Renilla luciferase and HCV Core Cellomics ArrayScan readouts from 50 and 12 plates validation runs, respectively. Results are expressed as mean and standard deviation.

