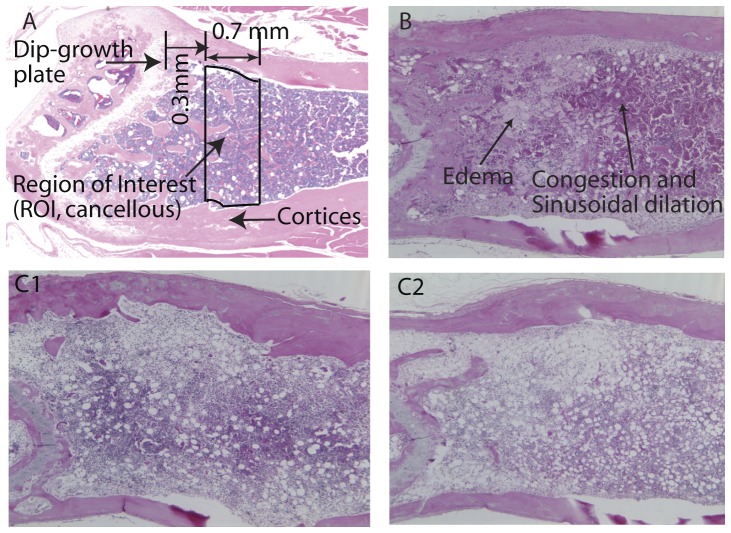
Figure 2. Schematic representation of bone and marrow.
A. region of interest in sagittal view of a normal control mouse. B. Sagittal section of bone marrow from an intact mouse 8 days post-irradiation. Note the areas of congestion and sinusoidal dilation characterized by increased density of red blood cell within the expanded vascular spaces; also present are areas of edema characterized by increased volume of pale pink fluid in the interstitial spaces. C. Sagittal sections of bone marrow 30 days after irradiation in intact (C1) and OVX (C2) mice. Note the more intensely purple areas indicative of higher hematopoietic activity in C1 compared with C2, as well as expanded adipose in C2 compared with C1.

