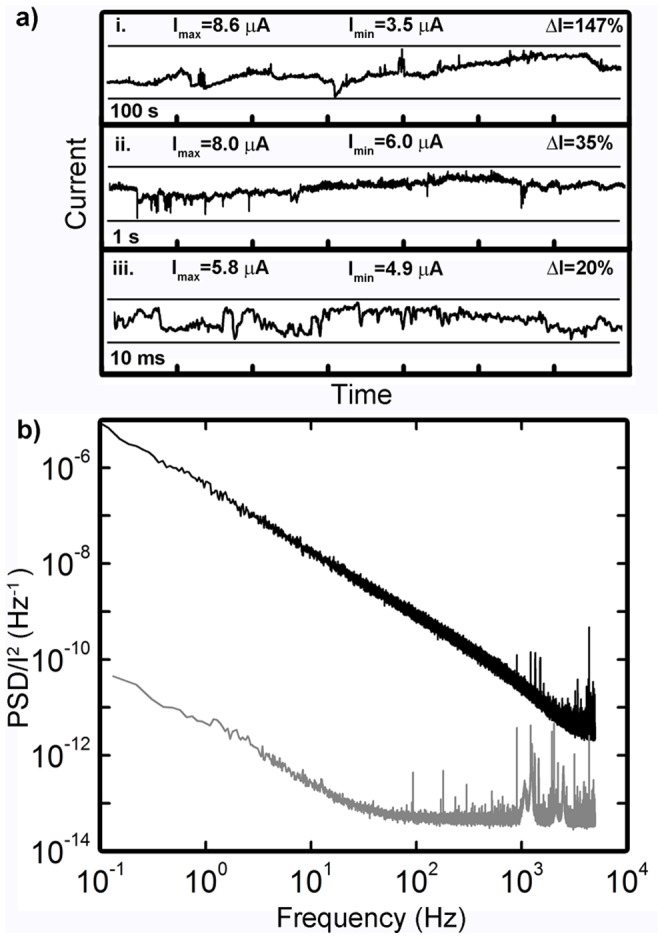
Figure 4. DC Response – recurrent dynamics.

(a) Time traces of current response to 1 V DC bias show large current increases and decreases at all time scales around a mean of 5.81 µA (172 kΩ); shorter time traces (ii–iii) are subsets of (i). Representative device parameters: ROFF>10 MΩ, RON<20 kΩ, VT = 3 V during activation (b) Fourier transforms of DC bias response for Ag control (grey) and functionalized Ag-Ag2S (black) networks. The power spectrum of the functionalized network displays 1/fβ power law scaling (β = 1.34).
