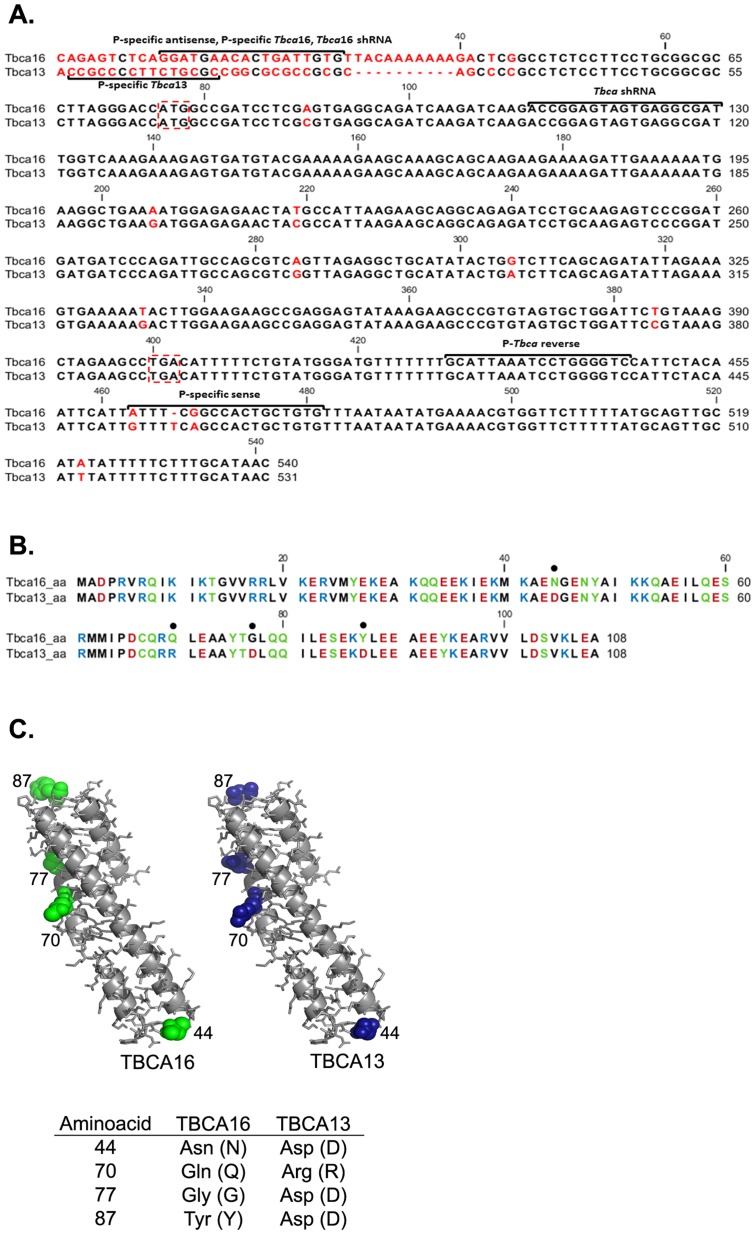
Figure 1. Comparison of Tbca13 and Tbca16 sequences and 3D Model Structure of TBCA16 and TBCA13.
Comparison between nucleotide sequences of Tbca16 and Tbca13 (A). The alignment shows 7 differences inside the coding region (the different nucleotides are in red, start and stop codons are inside a red dashed box). The regions where the different primers/shRNAs were designed are indicated. (B) Comparison of the aminoacid sequences of the putative TBCA16 and theTBCA13 protein, aminoacids are colored according to their polarity. The 4 differences are signaled with a black dot above the respective aminoacid (B). The sequences in (A) and (B) were done using the CLC Sequence Viewer 6.5.3 Program. (C) TBCA13 and TBCA16 3D models obtained using the program PyMOL [55] program (C). The aminoacid differences are indicated in the table, accordingly to the aminoacid position.

