
Figure 2. Study of Tbca16 and Tbca13expression in different mouse tissues by RT-PCR.
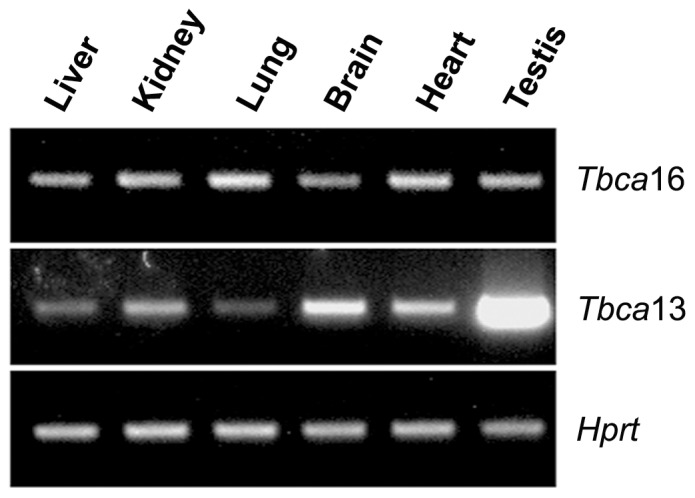
RT-PCR analysis of Tbca13 and Tbca16 transcript levels using total RNA samples extracted from different mouse tissues (3 mice, 25 post-natal days old, were used in this analysis). In contrast with Tbca13 expression, Tbca16 is not highly expressed in testis. The Hprt expression was analyzed as an endogenous control.