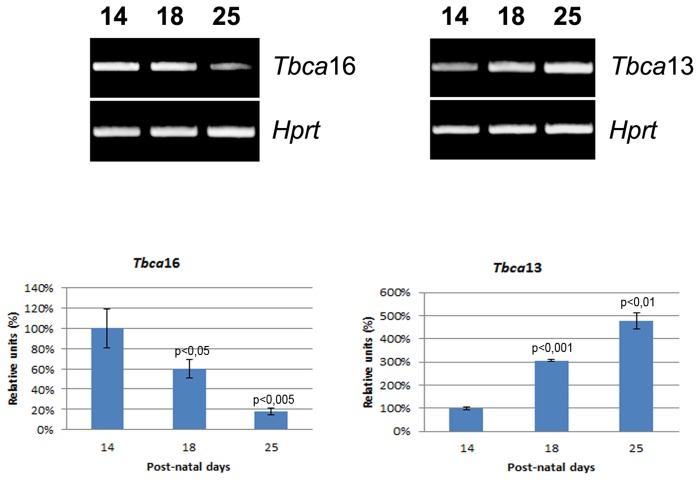
Figure 3. Study of Tbca16 and Tbca13 expression pattern during mouse spermatogenesis.
Total RNA was obtained from mouse testis at different stages of maturation (3 sets of 14, 18 and 25 post-natal days old mice were used in this study). The Tbca16 and Tbca13 expression levels were analyzed by semi-quantitative RT-PCR and normalized by the expression of Hprt. During spermatogenesis the steady-state levels of Tbca13 mRNA increase whereas a decrease in the steady-state levels of Tbca16 mRNA is observed. Normalized cDNA levels are expressed as a percentage of maximal value (100%) for the 14 post-natal day. The p values were determined in comparison to the 14 post-natal days. The graphic bars are the mean±s.d. (error bars) of three independent assays. Statistical significance was calculated using a t-test.

