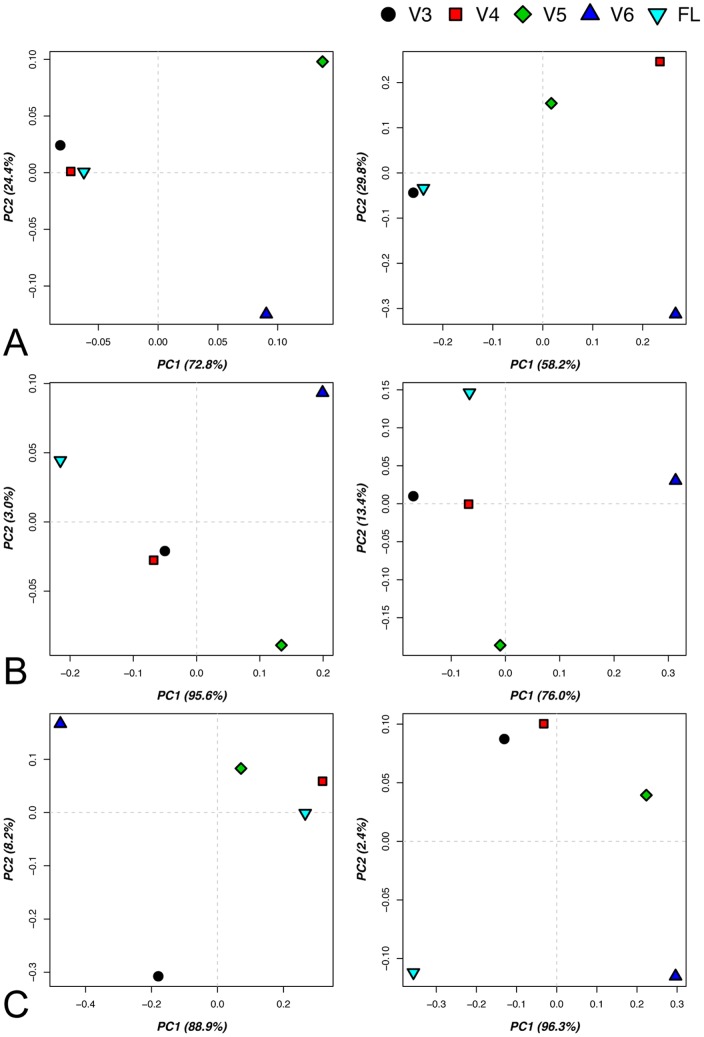
Figure 7. Taxonomy, OTU (3% sequence distance) analysis and Unifrac results of the performed simulation.
A) PCA results of matrix generated by sample distances based on classified sequence relative abundance (left) and presence absence (right) for the V regions and FL datasets. B) Similarly to A for OTU relative abundance (left) and presence absence (right). C) PCA results for matrices generated using the weighted (left - phylotype relative abundance based) and unweighted (right - phylotype occurrence based) Unifrac analysis result distances between samples for the V regions and FL datasets.

