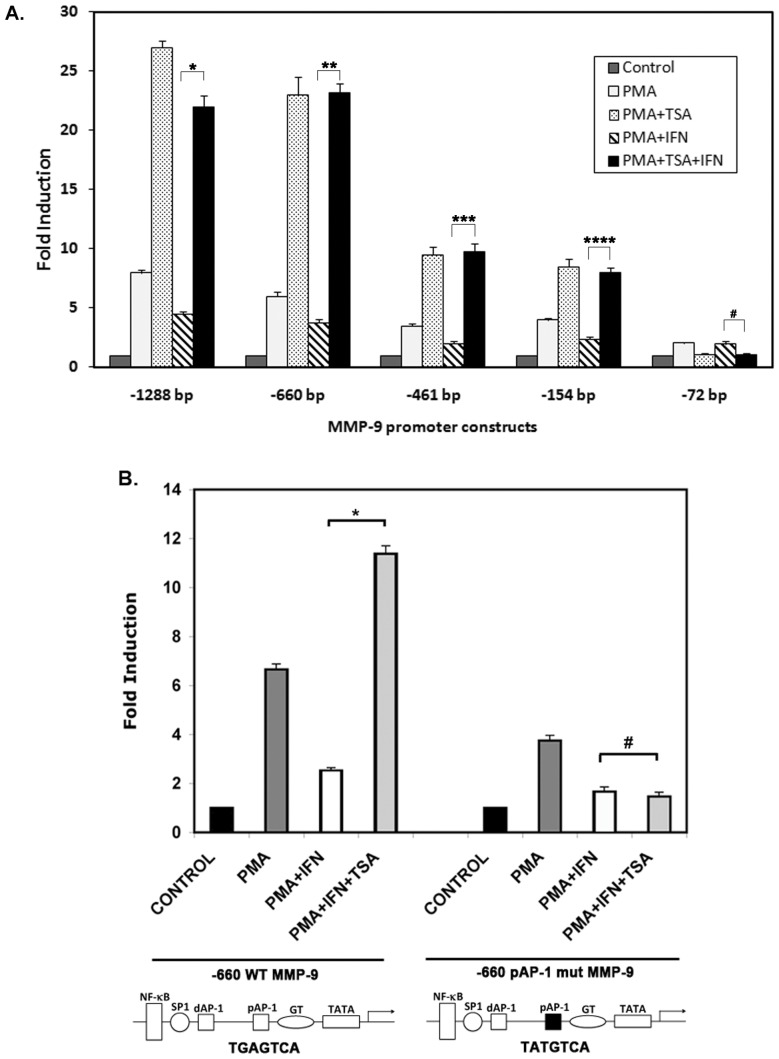
Figure 3. Involvement of HDAC in IFNβ mediated repression of MMP-9 promoter.
(A) Response of various promoter deletion constructs to a HDAC inhibitor. HT1080 cells were transiently co-transfected with MMP-9 promoter constructs. 24 hours after transfection, cells were pooled and redistributed amongst the wells, so that transfection efficiency was the same for all samples. 48 hours after transfection, the cells were treated with 220 nM TSA, 30 nM PMA and 100 U/mL IFNβ as indicated for 18 hours prior to preparation of cell extracts. Cell extracts were assayed for firefly luciferase activities, and normalized by protein concentration to account for any cell concentration differences between samples. Grey bars: untreated, white bars: PMA treated, grey stippled bars: PMA + TSA, hatched bars: IFNβ, and black bars: PMA + IFNβ + TSA. The P-values were calculated using statistical analysis software. As indicated above bars, *, **, ***, and **** symbols indicate P values that indicate significant difference (0.0011, 0.0009, 0.0007, and 0.0008 resp.) and the symbol # indicates a P value of 0.0874 (no significant difference) with significant values being <0.01. (B) AP-1 binding to the proximal site is required for HDAC1 recruitment to MMP-9 promoter in response to IFNβ. HT1080 cells were transfected in 6-well dishes in triplicates with −660 MMP-9 promoter deletion construct containing a point mutation in the proximal AP-1 site, which renders the binding site non-functional, or with wild type −660 MMP-9 construct. Cells were prepared as described previously, including treatments with 220 nM TSA, 30 nM PMA and 100 U/mL IFNβ for 18 hours prior to preparation of cell extracts. Cell extracts were assayed for firefly luciferase activities, and normalized by protein concentration to account for any cell concentration differences between samples. Black bars: untreated values considered as 1 for each construct, dark grey bars: PMA treated, white bars: PMA + IFNβ, and light grey bars: PMA + IFNβ + TSA. The experiment was repeated three times and the error bars represent standard deviation calculated from three separate experiments. The P-values were calculated using statistical analysis software. As indicated above the bars, * symbol indicates a P value of 0.0004 (significant difference) and the symbol # indicates a P value of 0.47 (no significant difference), with significant values being <0.01.

