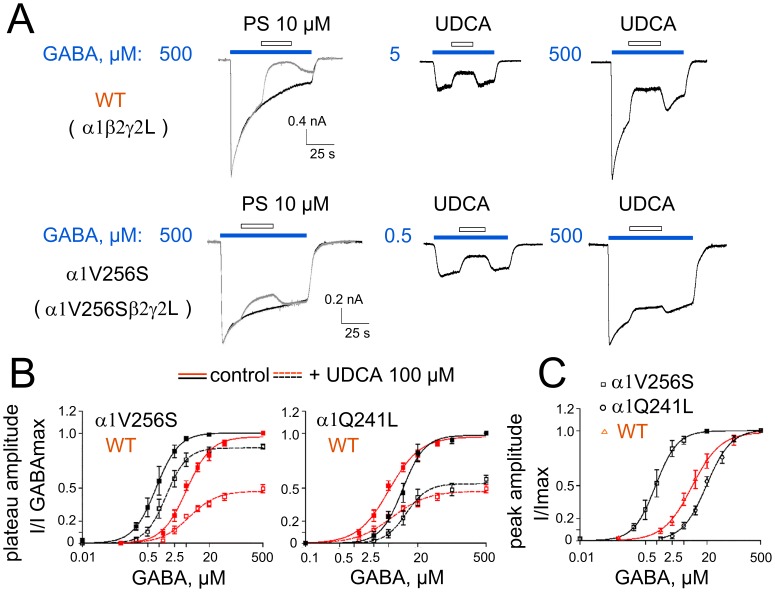
Figure 7. Impairment of GABAAR-block by UDCA in the mutant α1V256S- but not α1Q241L-containing receptors.
A. GABA-evoked currents, in response to maximal concentrations and concentrations around EC25, and their inhibition by pregnenolone sulphate (PS) or UDCA 100 µM. B. GABA dose-response curves constructed for the plateau amplitudes measured for control: immediately before UDCA application, which started 15–25 s after the beginning of the GABA application; and for the amplitude of blocked current: at the beginning of UDCA application (first point at a steady-state level). The inhibition of maximal GABA-responses by UDCA is significantly smaller in WT (47±3% of control, n = 7) and mutant α1Q241L receptors (54±2% of control, n = 5, no difference with WT) than in the mutant α1V256S receptors (87±1% of control, n = 5; p = 0.0047 vs WT). UDCA does not significantly modify the EC50 and nH values for GABA in the WT (6±1 µM; 1.2±0.2 versus 5.1±0.5 µM; 1.4±0.1 in control), in the mutant α1Q241L (11.5±1.2 µM; 2.0±0.4 versus 9.8±0.7 µM; 1.9±0.2 in control) and α1V256S (1.5±0.07 µM; 1.6±0.1 versus 0.83±0.03 µM; 1.5±0.06 in control) receptors. C. GABA dose-response curves constructed from peak current amplitude values normalized on maximal GABA-evoked current for the WT (EC50 = 8±0.5 µM; nH = 1.2±0.1; n = 8), α1V256S (EC50 = 0.9±0.03 µM; nH = 1.5±0.06; n = 5) and α1Q241L (EC50 = 20±1 µM; nH = 1.4±0.1; n = 5) receptors of α1β2γ2L-composition expressed in HEK293 cells.

