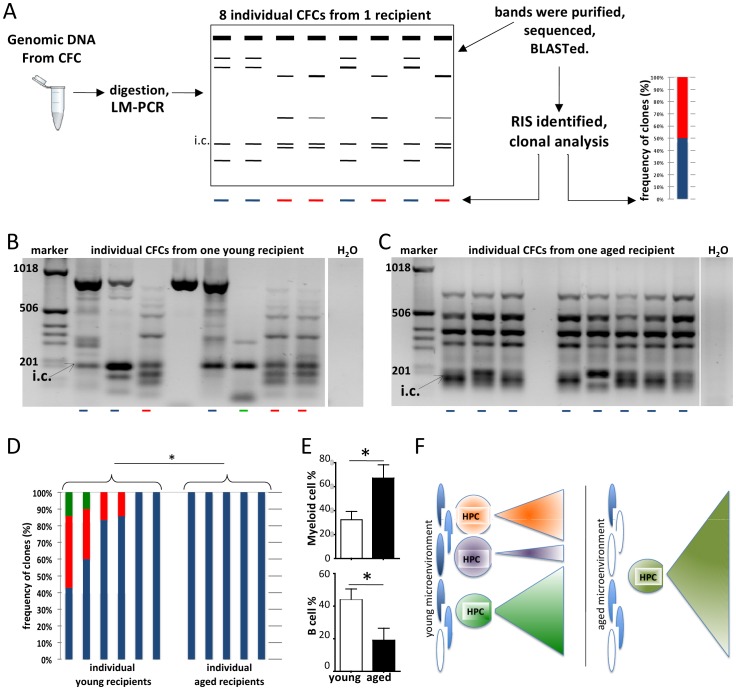
Figure 2. Coexistence of balanced HSC populations is characteristic for young microenvironment whereas an aged microenvironment favors the expansion of single dominant hematopoietic clone.
(A) Schematic representation of the retroviral insertional mutagenesis screen. DNA was extracted from individual CFCs (average: 7.3±1.8 GFP+CFCs/mouse were isolated) and digested with four-cutter enzymes. After LM-PCR, the recovered bands were isolated and sequenced. The sequences were aligned to the mouse genome with NCBI/BLAST program. The RISs were identified and the closest genes (within a ±100 kb window) were listed. Based on the LM-PCR band-pattern and the identified RISs, clonal analyses were performed. (B) Representative agarose gel analysis of LM-PCR performed on methylcellulose colonies isolated from BM of one representative young transplanted mouse. Clonality was identified based on the band pattern and DNA sequence information on individual bands. Distinct colors represent distinct clones. (C) Insertion sites recovered by LM-PCR from CFCs of one representative aged recipient mouse. The red arrows depict distinct GFP peaks. i.c.: internal control bands represent PCR products amplified from the viral genome. (D) Distribution of clonality within the GFP+ CFC population of young and aged recipient mice determined by the LM-PCR pattern and sequence information. (E) Flow cytometric analyses of PB of young and aged recipient mice (same mice were used in clonal analysis and RISs identification). Myeloid cells were identified based on Gr1 and Mac1 expression and B220 was used as B cell marker. (young mice n = 6, aged mice n = 5, from 3 independent experiments), * = p<0.05 (F) Proposed model for clonality of hematopoiesis in young and aged microenvironment.

