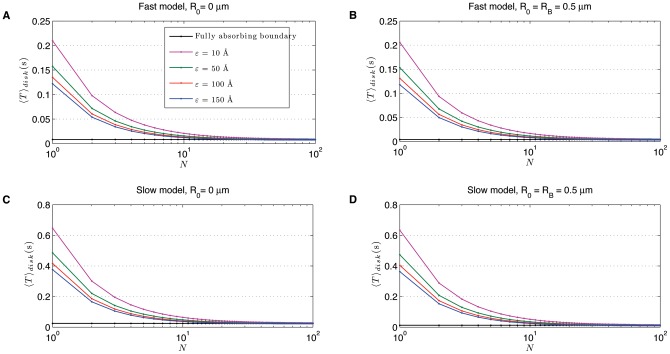
Figure 4. Dependence of the GMFPT  , expressed in seconds, as function of the number
  equidistant circular targets on the boundary with two different radius
  of the initial localization area
  : the extreme case when
  and when
  , where
  is the disk radius.
Panels A and C represent the  case, corresponding to an effector that starts at the origin, whereas panels B and D correspond to an initial particle localization being anywhere inside the bacterium. Each of the panels shows the GMFPT as function of
  for four choices of target radius
  = 10, 50, 100 and 150 Å (line colour, see legend in panel A). The black curves represent a limiting case in which the entire boundary of the domain is a target; i.e.
  becomes the average time required to arrive at the boundary. In the top row we have considered the ‘fast’ model with
 m
m /s, whereas the bottom row displays results for the ‘slow’ model with
 m
m /s. In all four panels
 m.
m.

