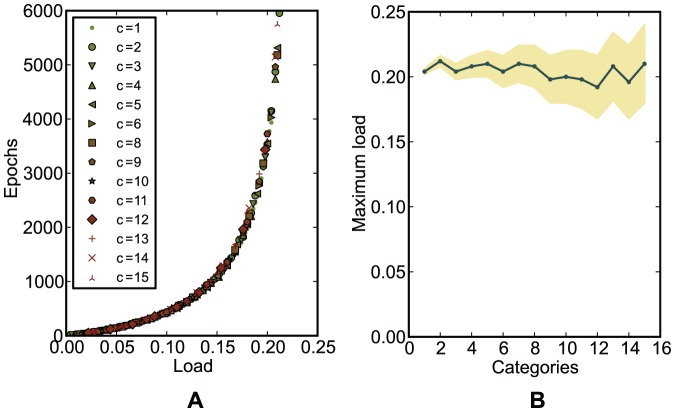
Figure 10. The dependence on the number of categories of the performance of E-learning for a classification problem.
(A) The average minimum number of epochs required for correct learning, as a function of the load  , for various numbers of categories
  . Regardless of
  , the points fall on the same curve. (B) The maximum load for which correct learning is achieved (the capacity
  ), as a function of the number of categories
  . The shaded area represents the uncertainty due to the fact that the load can vary only discretely, in steps of
  , for a particular
  . The capacity is approximately constant for all
  .
.

