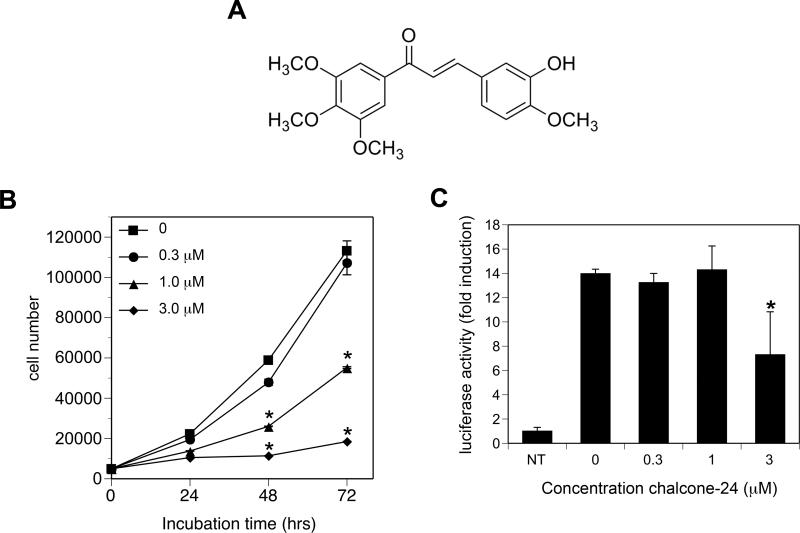
Fig. 1. Chalcone-24 inhibits A549 cell proliferation.
(A) Structure of chalcone-24. (B) A549 cells were incubated for 24, 48, or 72 hours without (squares) or with the following concentrations of chalcone-24: 0.3 μM (circles), 1 μM (triangles), or 3 μM (diamonds). Cell number was determined by an MTT assay as described in Materials and methods. The zero time point represents the number of cells that were initially plated. The symbols represent the average of triplicates ± SEM. Asterisks denote values that were determined to be statistically significantly different from cells incubated without chalcone-24 (p < 0.001) by using a 1-way ANOVA and Bonferroni post-test. The results of the MTT assays were confirmed by counting live and dead cells using trypan blue exclusion (data not shown). (C) A549 cells stably transfected with NF-κB-luc were incubated for 8 hours without (NT) or with TNF-α in the presence of the indicated concentrations of chalcone-24. NF-κB activity was determined as described in Materials and methods. The bars represent the average of triplicates ± SEM. The values represent fold induction of luciferase activity relative to non-treated controls (NT). Asterisks denote values that were determined to be statistically significantly different from cells incubated with TNF-α but without chalcone-24 (p < 0.001) by using a 1-way ANOVA and Bonferroni post-test. The data shown are representative of at least two independent experiments.

