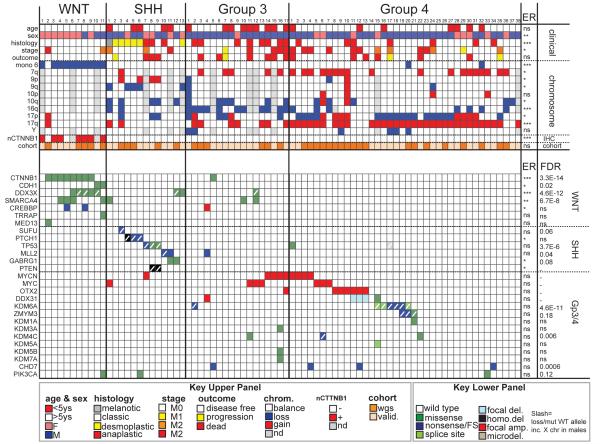
Figure 1. The genomic landscape of medulloblastoma.
Top: clinical, histologic, gross chromosomal, nuclear CTNNB1 (nCTNNB1), and cohort (discovery or validation) details of 79 medulloblastomas by subgroup. Below: genetic alterations detected in 27 genes of particular interest. Color key at bottom. ANOVA (continuous) or Fisher’s exact (categorical) p-value is shown right. False discovery estimates (FDR) of each mutation are shown right. ***=P<0.0005; **=P<0.005; *=P<0.05; ns=not significant.

