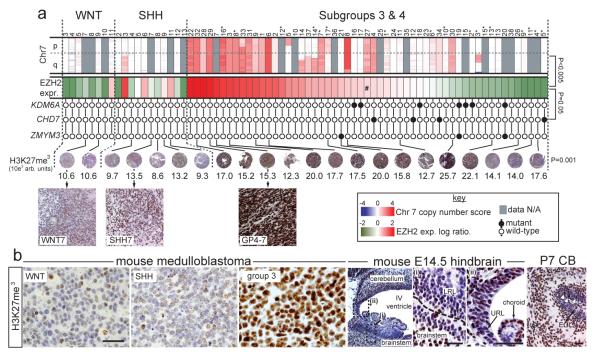
Figure 2. Deregulation of H3K27me3 in subgroup-3 and 4 human and mouse medulloblastoma.
(a) Top row, SNP profiles of chromosome 7 copy number in medulloblastomas (samples as Figure 1; *=subgroup-3 cases). Second row, expression of EZH2. Subgroup-3 and 4 tumours are ordered left to right by expression level, #=median expression point (Bonferroni corrected p-value of EZH2 expression vs. chromosome 7 gain). Third row, mutation status of KDM6A, CHD7 and ZMYM3 (p-value, Fisher’s exact mutations vs. EZH2 expression). Fourth row, H3K27me3 immunohistochemistry (numbers=colorimetry, p-value ANOVA). (b) H3K27me3 expression (right) in mouse Blbp-Cre ; Ctnnb1+/lox(Ex3) ; Tp53flx/flx (WNT), Ptch1+/−; Tp53−/− (SHH) and Myc ; Ink4c−/− (group 3) medulloblastomas and (left) developing hindbrain. high power views of E14.5 (i) LRL and (ii) upper rhombic lip (URL). IGL=internal granule layer, EGL=external germinal layer. Scale bar=50μm. White arrows in P7 cerebellum pinpoint H3K27me3 cells in the EGL.

