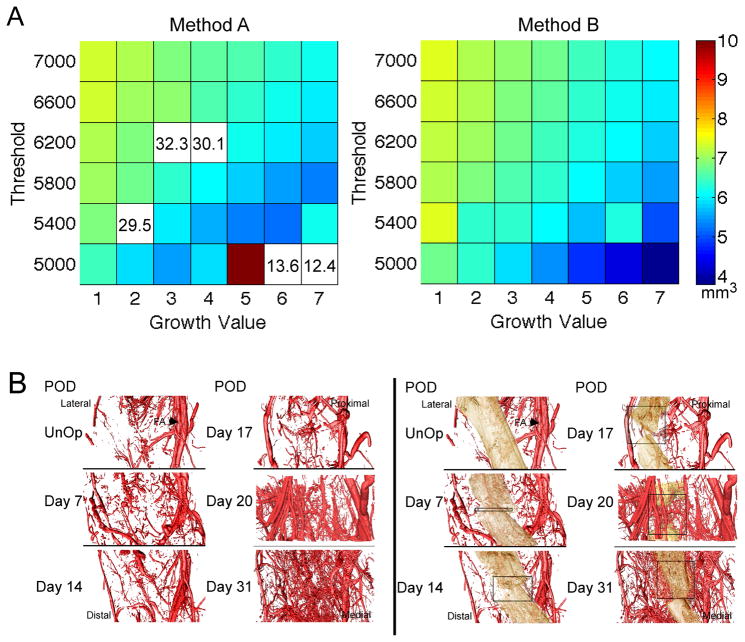
Figure 2. Results of the μCT methods to co-register vasculature and bone tissues.
(A) The volume of mineralized tissue (BV (mm3)) is shown on the colorplots as a function of threshold (16-bit scale) and growth value for the two growth methods. For growth method A, some combinations of threshold and growth value yielded extreme values of BV; these values are outside the color range and are instead listed on the plot. (B) Representative renderings of the vasculature (left side) and the vasculature and mineralized tissue (right side) across the time-course of DO. Vascular tissues are false-colored red. Mineralized tissue is false-colored tan. The position of the femoral artery (FA) is denoted with an arrow in the renderings of the un-operated controls. Boxes are approximations of the total width of the distraction gap at each time-point.

