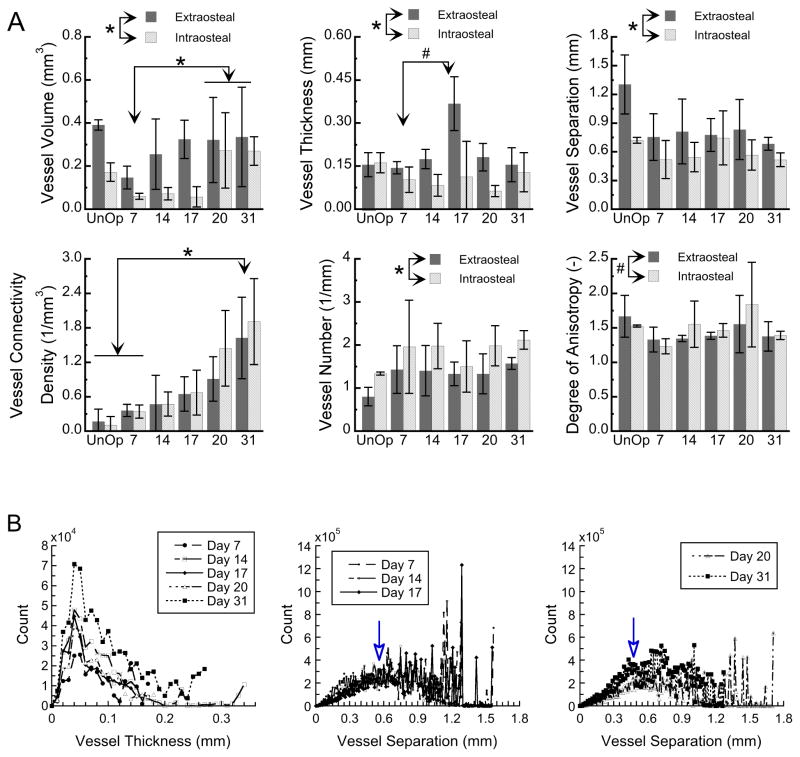
Figure 3. Morphometric analysis of the 3-D vascular reconstructions over the 31-day time-course of distraction osteogenesis.
(A) Vessel volume and morphometric parameters of the vessel network are shown for the extraosteal and intraosteal VOIs at each time-point and for un-operated controls (“UnOp”). Post-operative day is indicated on the abcissa. Column heights and error bars indicate group means and standard deviations, respectively. *: p<0.05. #: 0.05<p<0.10. (B) Histograms showing the entire distributions of vessel thickness (left panel) and vessel separation (middle and right panels) throughout the regenerate and surrounding musculature, averaged over all specimens at a given time-point. Arrows indicate the peaks in the symmetric portions of the distributions of vessel separation. Note the leftward shift in the position of the arrow from day 17 to day 20, indicating a decrease from the earlier to later timepoints in a characteristic separation distance between vessels.

