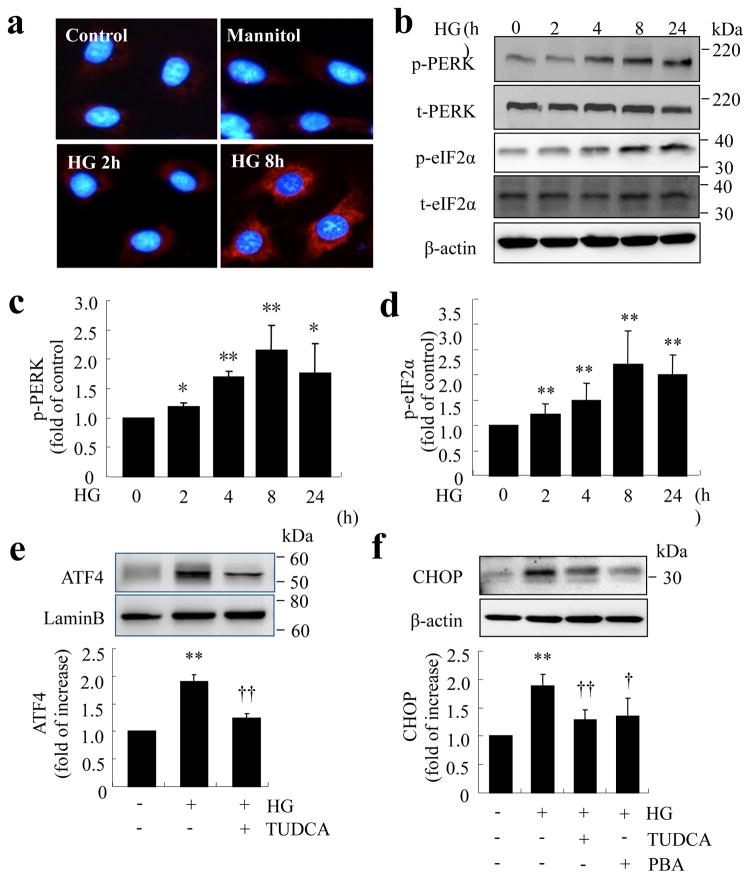
Fig. 2.
Increased levels of ER stress markers in TR-iBRB cells exposed to high glucose. (a–d) TR-iBRB cells were treated with high glucose (25 mmol/l, HG) for 0–24 h. ER stress markers were determined by immunocytochemistry or western blot analysis. (a) Immunohistochemistry showing increased GRP78 level after treatment with high glucose. (b–d) Western blot analysis of phosphorylated (p) and total (t) PERK and eIF2α. (b) Representative blots from three independent experiments. Production of p-PERK (c) and p-eIF2α (d) was quantified by densitometry (mean±SD, n=3). *p<0.05, **p<0.01 vs control. (e,f) TR-iBRB cells were treated with high glucose (25 mmol/l, HG) with or without chemical chaperone PBA (5 mmol/l) or TUDCA (5 mmol/l) for 16 h. Levels of ATF4 (e) and CHOP (f) were examined by western blot analysis in nuclear extracts or whole cell lysates and quantified by densitometry (mean±SD, n=3). **p<0.01 vs control, †p<0.05 vs HG, ††p<0.01 vs HG

