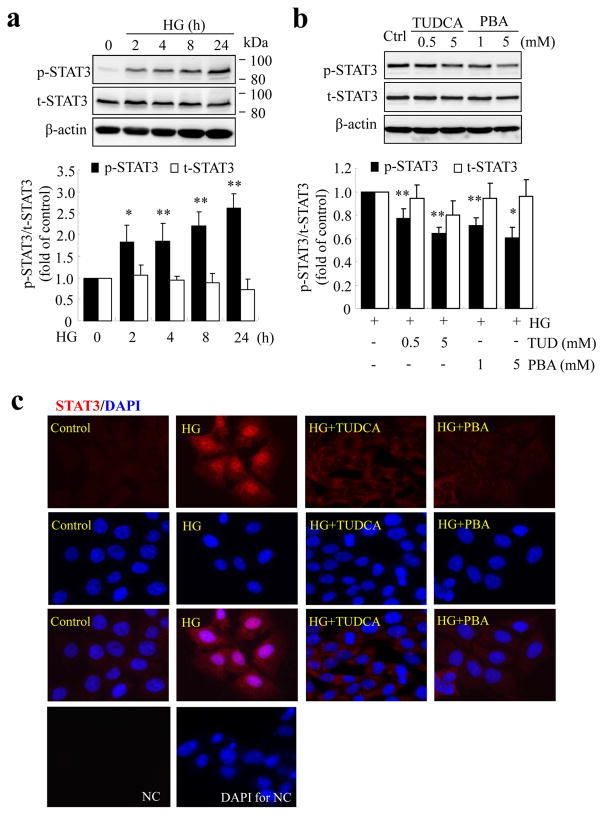
Fig. 4.
ER stress is implicated in high glucose-induced STAT3 activation in TR-iBRB cells. (a) TR-iBRB cells were treated with high glucose (HG) for up to 24 h and the levels of phosphorylated STAT3 (p-STAT3) and total STAT3 protein (t-STAT3) were measured by western blot analysis and quantified by densitometry (mean±SD, n=3). (b) TR-iBRB cells were treated with high glucose with or without TUDCA or PBA for 16 h. Levels of p-STAT3 and t-STAT3 were determined by western blot analysis and quantified by densitometry (mean±SD, n=3). Black bars, p-STAT3; white bars, t-STAT3. *p<0.05, **p<0.01 vs HG. (c) Immunostaining of STAT3 showing nuclear translocation of STAT3 in HG-treated cells, but not in those treated with HG+TUDCA (5 mmol/l) or HG+PBA (5 mmol/l). STAT3 (red) and DAPI (blue). NC, negative control

