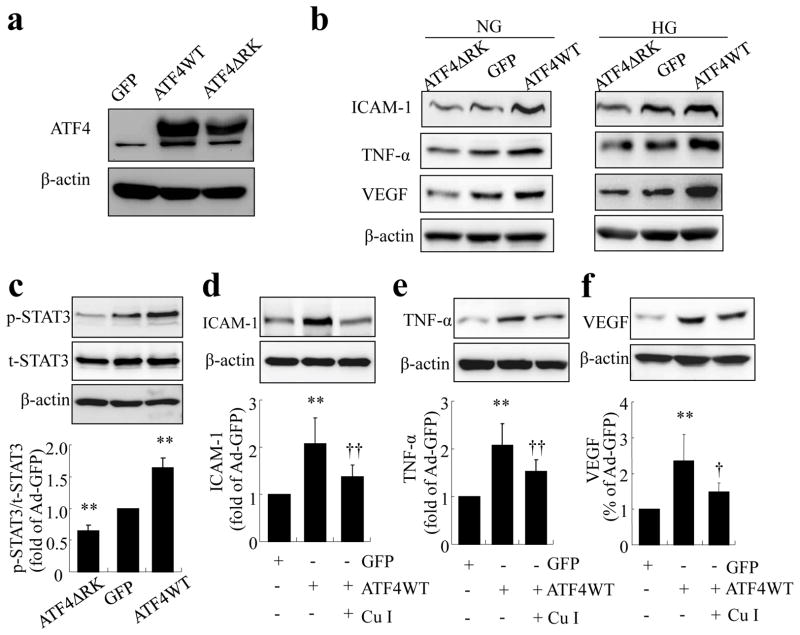
Fig. 7.
ATF4 upregulates inflammatory gene expression through activation of STAT3 in TR-iBRB cells. (a,b) TR-iBRB cells were transfected with Ad-GFP, Ad-ATF4 WT or Ad-ATF4ΔRK for 24 h, followed by treatment with normal glucose (NG) or high glucose (HG) for 24 h. Levels of ATF4 (a), ICAM-1 (b), TNF-α (b) and VEGF (b) were determined by western blot analysis and quantified by densitometry (mean±SD, n=3; see ESM Fig. 1). (c) TR-iBRB cells were transfected with Ad-GFP, Ad-ATF4WT or Ad-ATF4ΔRK for 24 h. Levels of phosphorylated (p)-STAT3 and total (t)-STAT3 were determined by western blot analysis and quantified by densitometry (mean±SD, n=3). **p<0.01 vs Ad-GFP. (d–f) TR-iBRB cells were preincubated with 100 nmol/l cucurbitacin I (Cu I) for 24 h, followed by transfection with Ad-ATF4WT for 24 h. Levels of ICAM-1, TNF-α and VEGF were determined by western blot analysis and quantified by densitometry (mean±SD, n=3). **p<0.01 vsAd-GFP; † p<0.05 vs Ad-ATF4WT, ††p<0.01 vs Ad-ATF4WT

