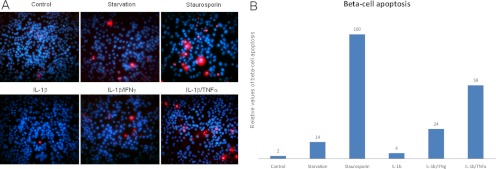
Fig. 1.
A, ApopTag images of pancreatic β-cells. The cells were treated as indicated under “Experimental Procedures.” The red cells represent labeled apoptotic cells with DAPI counterstaining of the nuclei. The magnification is 40×. B, relative values of β-cell apoptosis upon different treatments using staurosporine as a positive control. The values are based on death cell counts from 10× magnification images (data not shown) after 24 h of stimulation.

